Here is a list of 17 KPI software platforms available today (in no particular order):
What are the 17 best KPI software?
Klipfolio is a cloud-based data visualization and dashboard tool that helps businesses track, analyze, and report on key performance indicators (KPIs).
Nick's Take
Klipfolio has a native mobile app that supports mobile dashboarding and KPI monitoring on the go. It is a dashboarding tool that powers faster decision-making by automating manual tasks associated with monitoring KPIs.
Features:
-Allows users to connect to over 70 data sources, including popular business intelligence tools such as Google Analytics, Salesforce, and Tableau.
-Offers a library of pre-built dashboards and visualizations for common KPIs.
-Enables users to build custom dashboards and reports from scratch.
- Provides real-time alerts when KPIs reach critical thresholds.
-Integrates with popular collaboration tools such as Slack and HipChat to easily share dashboards and KPIs.
Pricing:
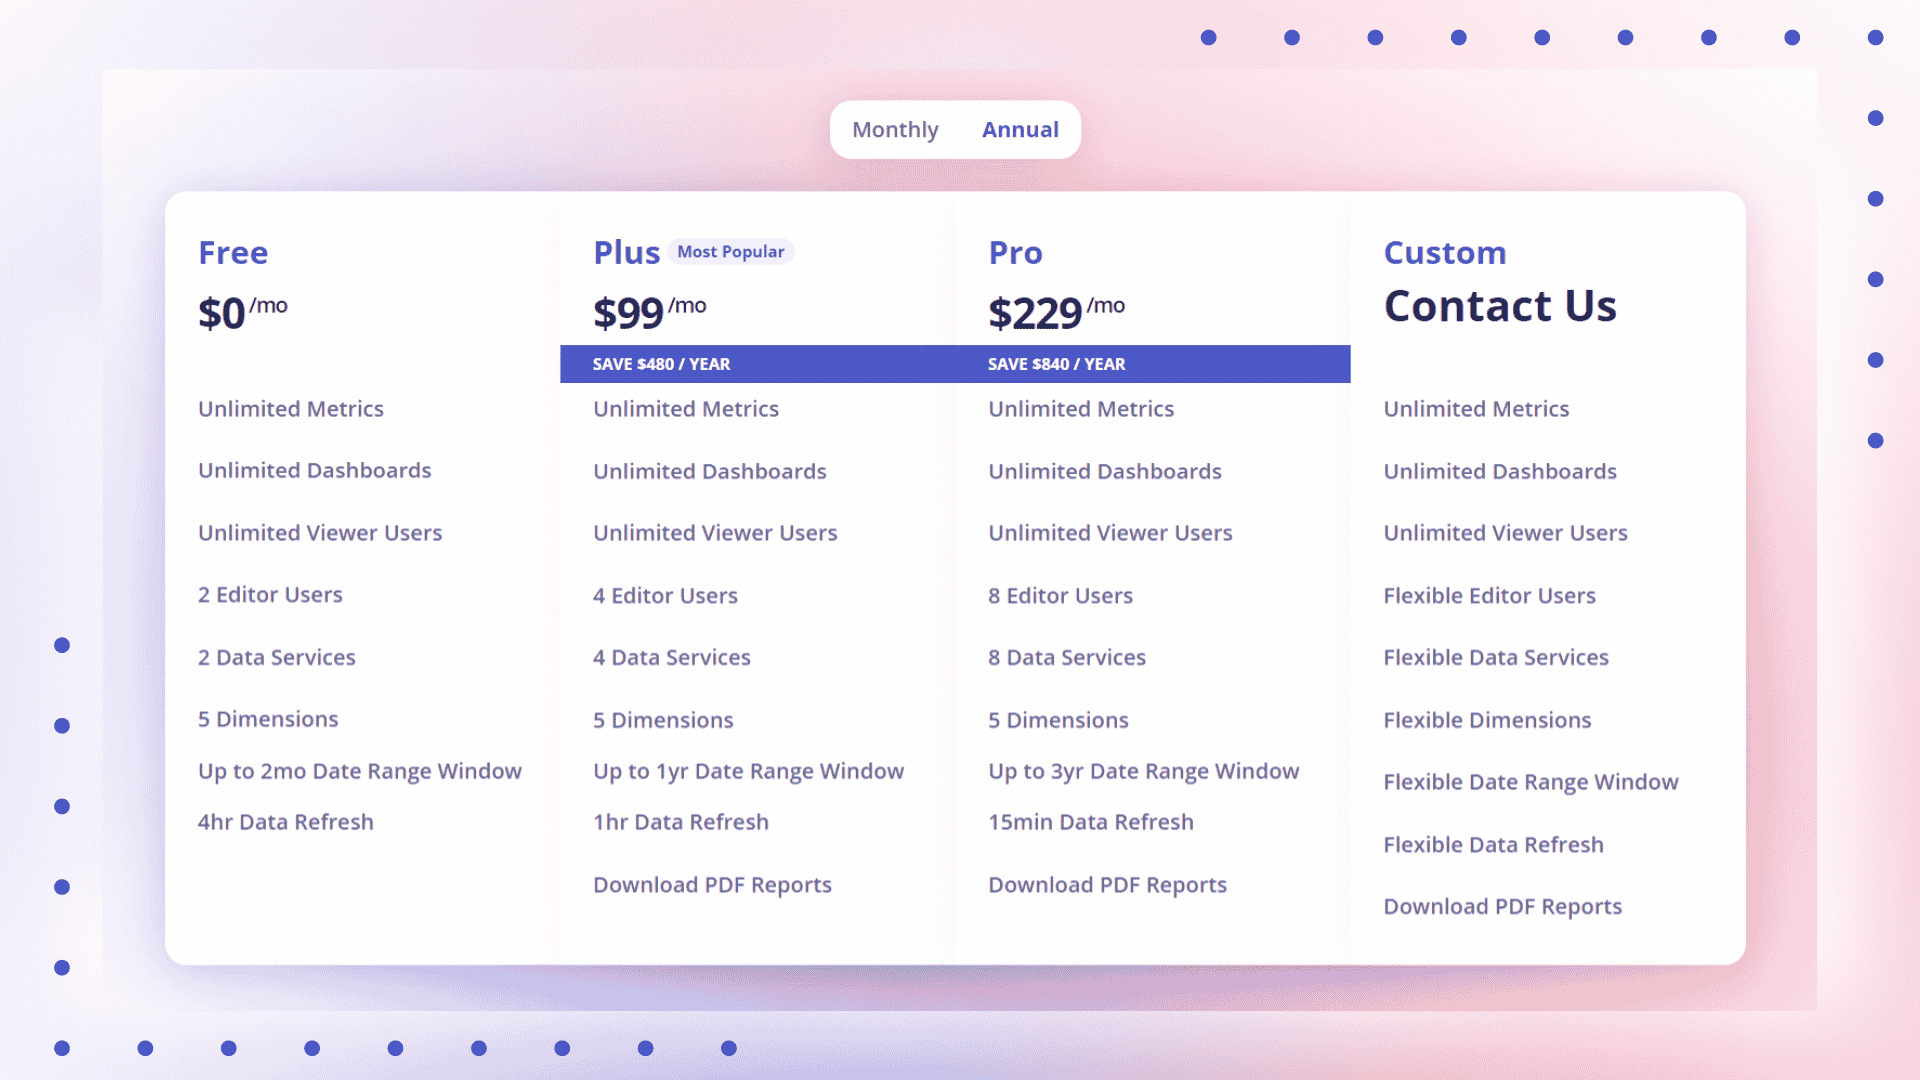
Klipfolio offers four different pricing plans: Starter ($29/month), Professional ($49/month), Team ($99/month), and Enterprise (custom pricing).
Geckoboard is a cloud-based KPI software that allows users to create real-time dashboards to track key performance indicators (KPIs). It is a data visualization tool that helps companies understand the flow of their business. Geckoboard allows users to view and manage all the data in one place, focusing clearly on the data that matters most.
Nick's Take
Geckoboard is software that helps you manage your KPIs, is easy to use and has various visualization options. It makes it easy to group and rearrange your data visualizations.
Features:
-Allows users to create custom widgets and dashboards
-Integrates with over 100 data sources
-Offers a wide range of built-in widgets
-Provides real-time data updates
-Enables collaboration among team members
Pricing:
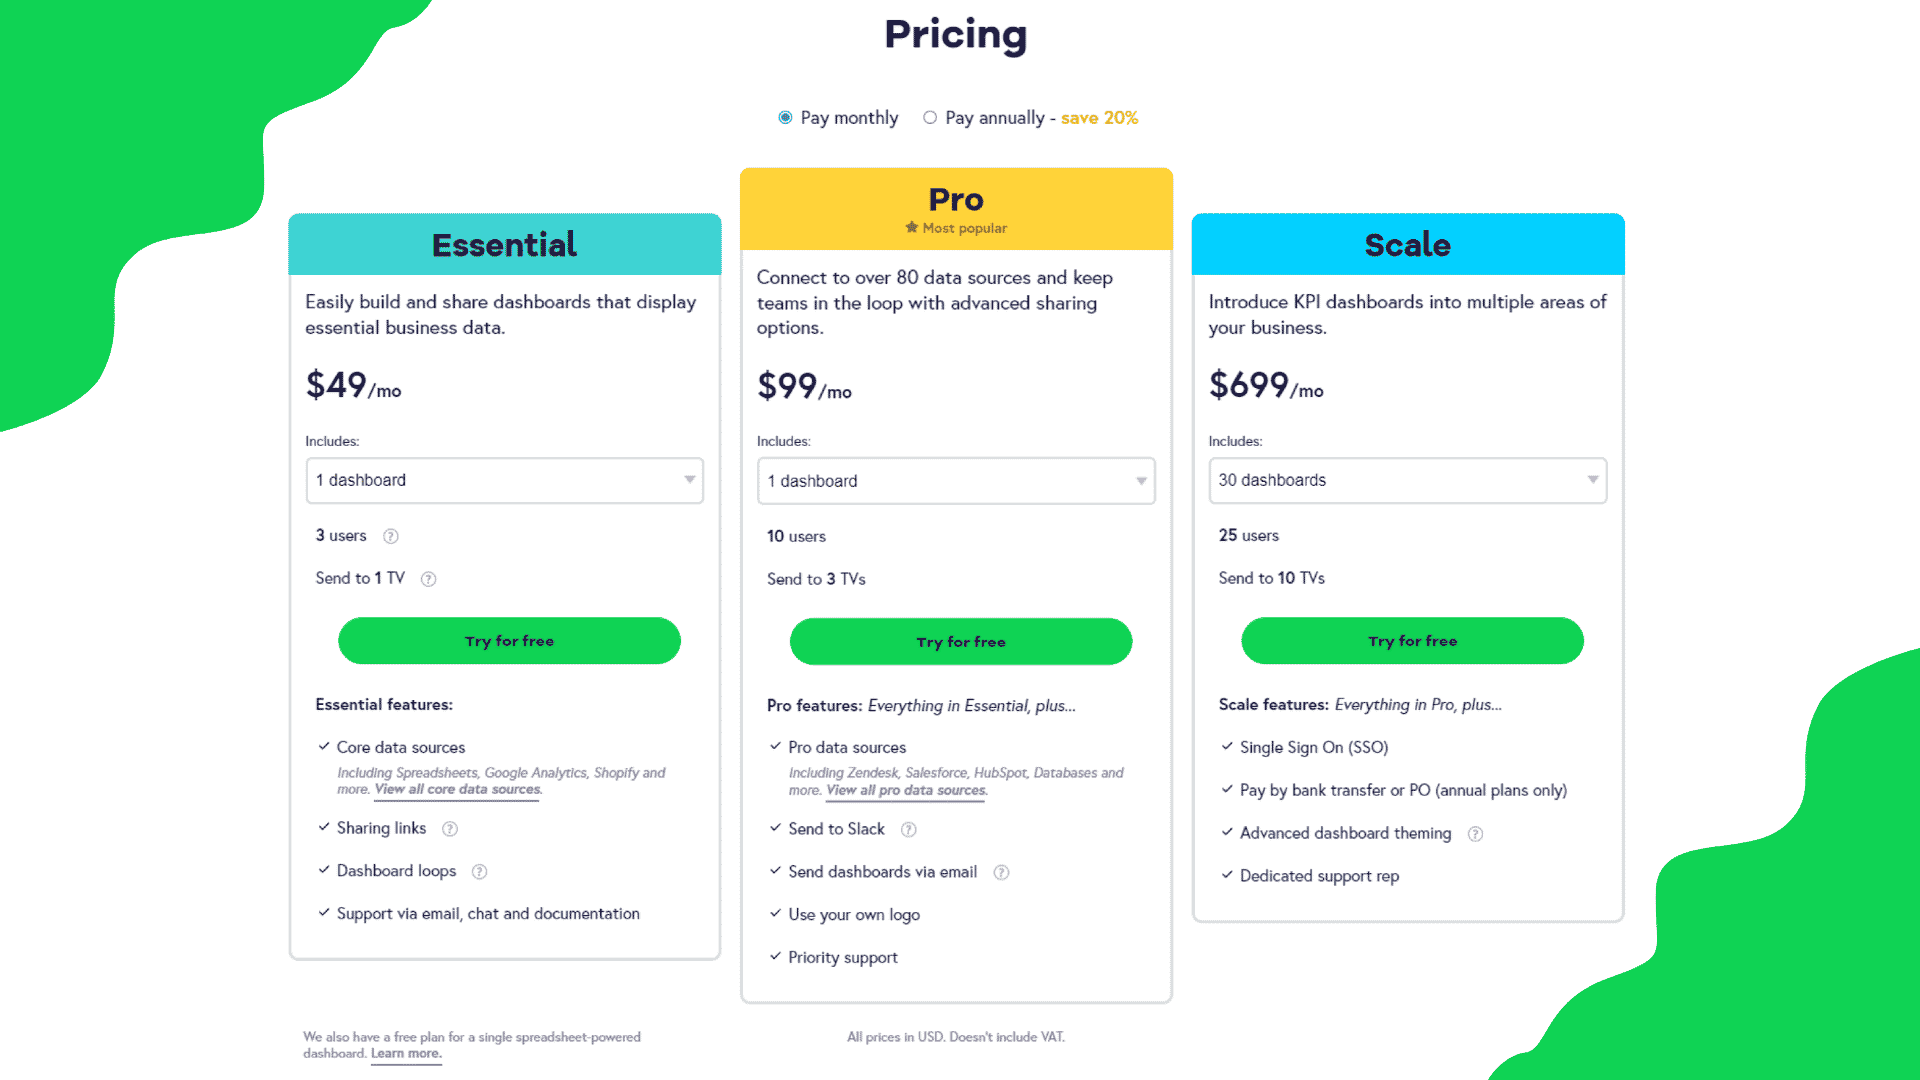
Geckoboard offers three pricing plans for businesses of different sizes. The Basic plan starts at $49 per month for up to 3 users, the Standard program begins at $99 per month for up to 10 users, and the Enterprise plan starts at $699 per month for 25 users.

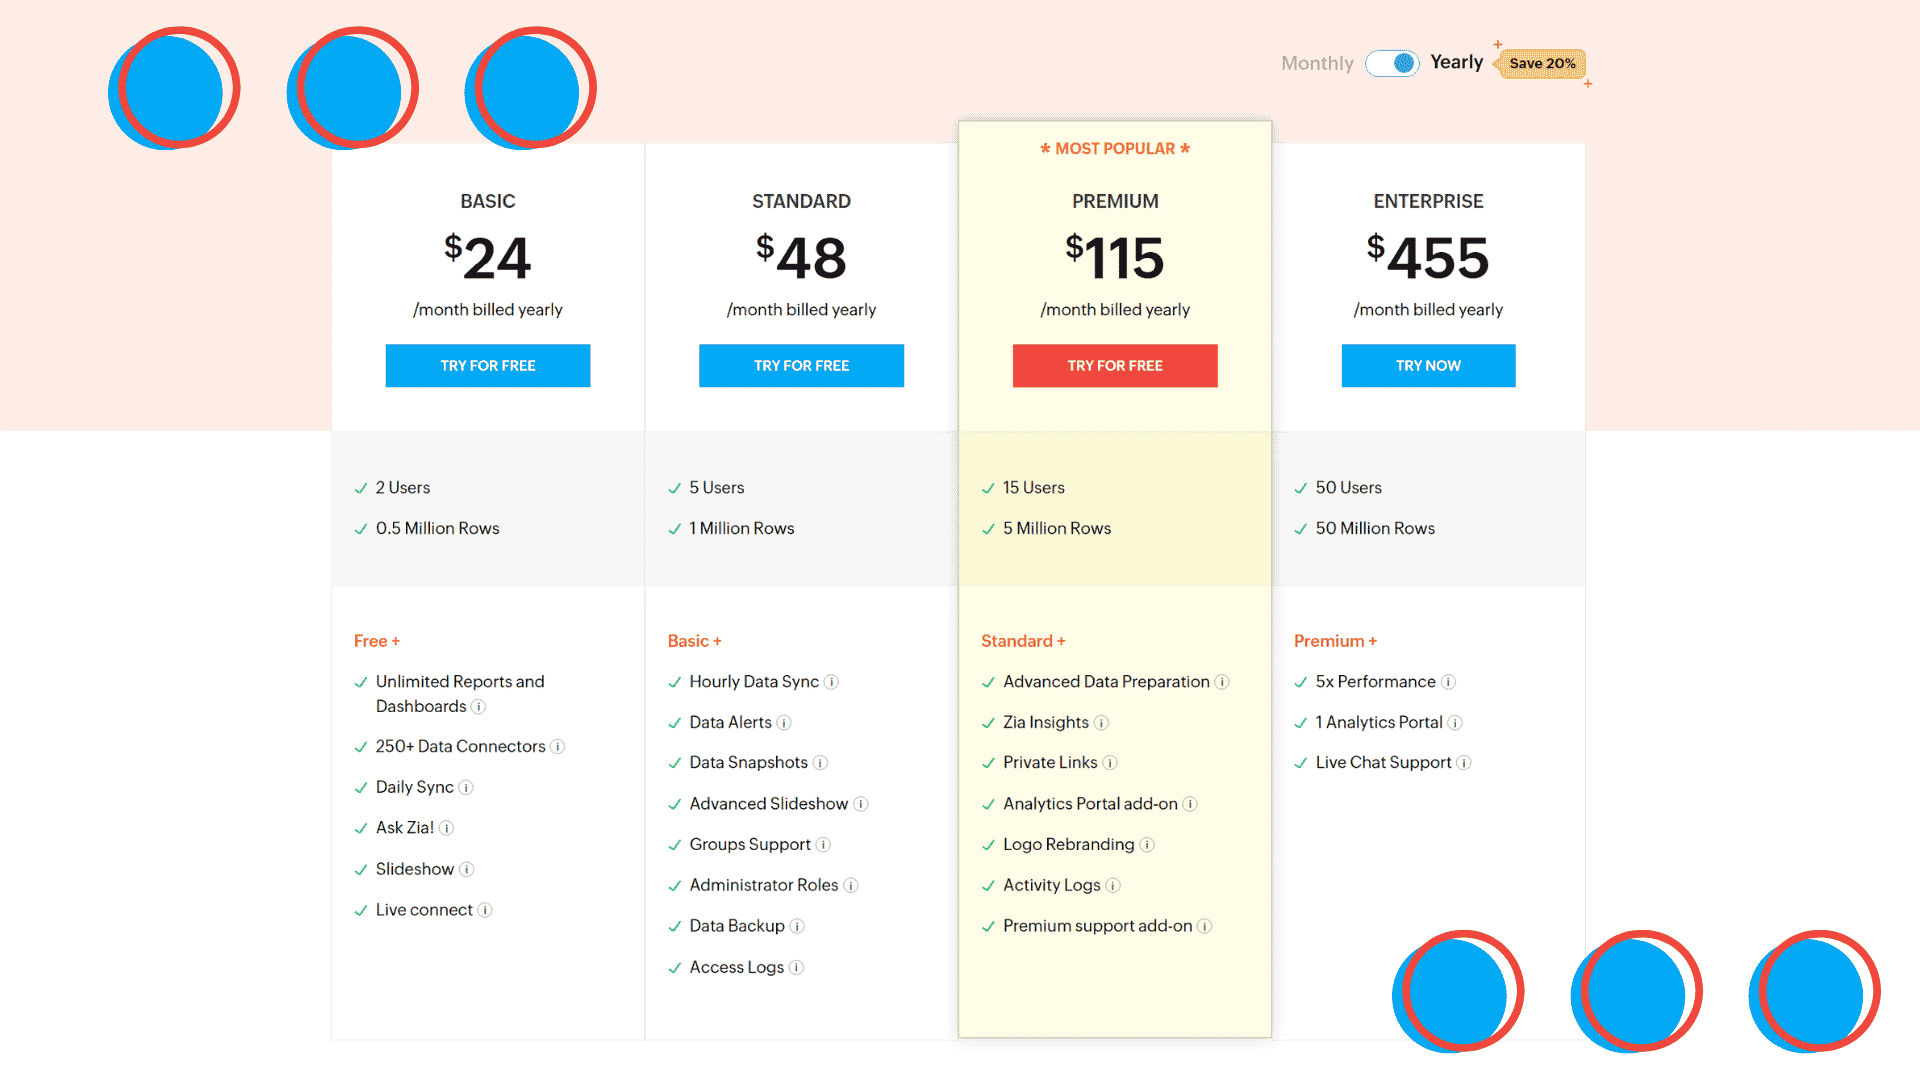
Zoho is a comprehensive KPI software that offers a wide range of features to help businesses track and improve their performance. It includes features such as goal setting, data visualization, and reporting. Pricing starts at $15 per month for the basic plan, which consists of 5 users.
Nick's Take
Zoho is an integrated application that runs your entire business. With Zoho One, you can easily manage and connect your sales team with the right apps to help them close more deals in less time.
Features:
-Goal setting: Zoho allows users to set goals and track progress towards them.
-Data visualization: Zoho provides various ways to visualize data, including graphs, charts, and maps.
-Reporting: Zoho generates reports that can be customized and exported in various formats.
-Integrations: Zoho integrates with a variety of other software products, making it easy to use with existing systems.
Pricing:
Zoho offers three pricing plans for businesses of different sizes. The Basic plan starts at $15 per month for up to 5 users, the Standard plan starts at $25 per month for up to 10 users, and the Enterprise plan starts at $50 per month for the unlimited user.
Scoro is a cloud-based work management software that helps businesses increase productivity and efficiency. It offers a complete solution for managing projects, clients, finances, and team collaboration.
Nick's Take
Scoro offers a free trial so users can get started with the software. The features of Scoro include automated billing and optimization of utilization.
Features include:
Project management: Scoro lets you create and manage projects, set deadlines, track progress, and bill your clients.
Client management: With Scoro, you can keep track of your client's contact details, communication history, and project files in one place.
Financial management: Scoro provides an overview of your company's financials, including invoicing, expenses, and profitability reports.
Team collaboration: Scoro makes it easy for team members to collaborate on projects by sharing files, tasks, and messages in one central place.
Integrations: Scoro integrates with popular productivity tools such as Google Apps, Dropbox, and Zapier.
Pricing:
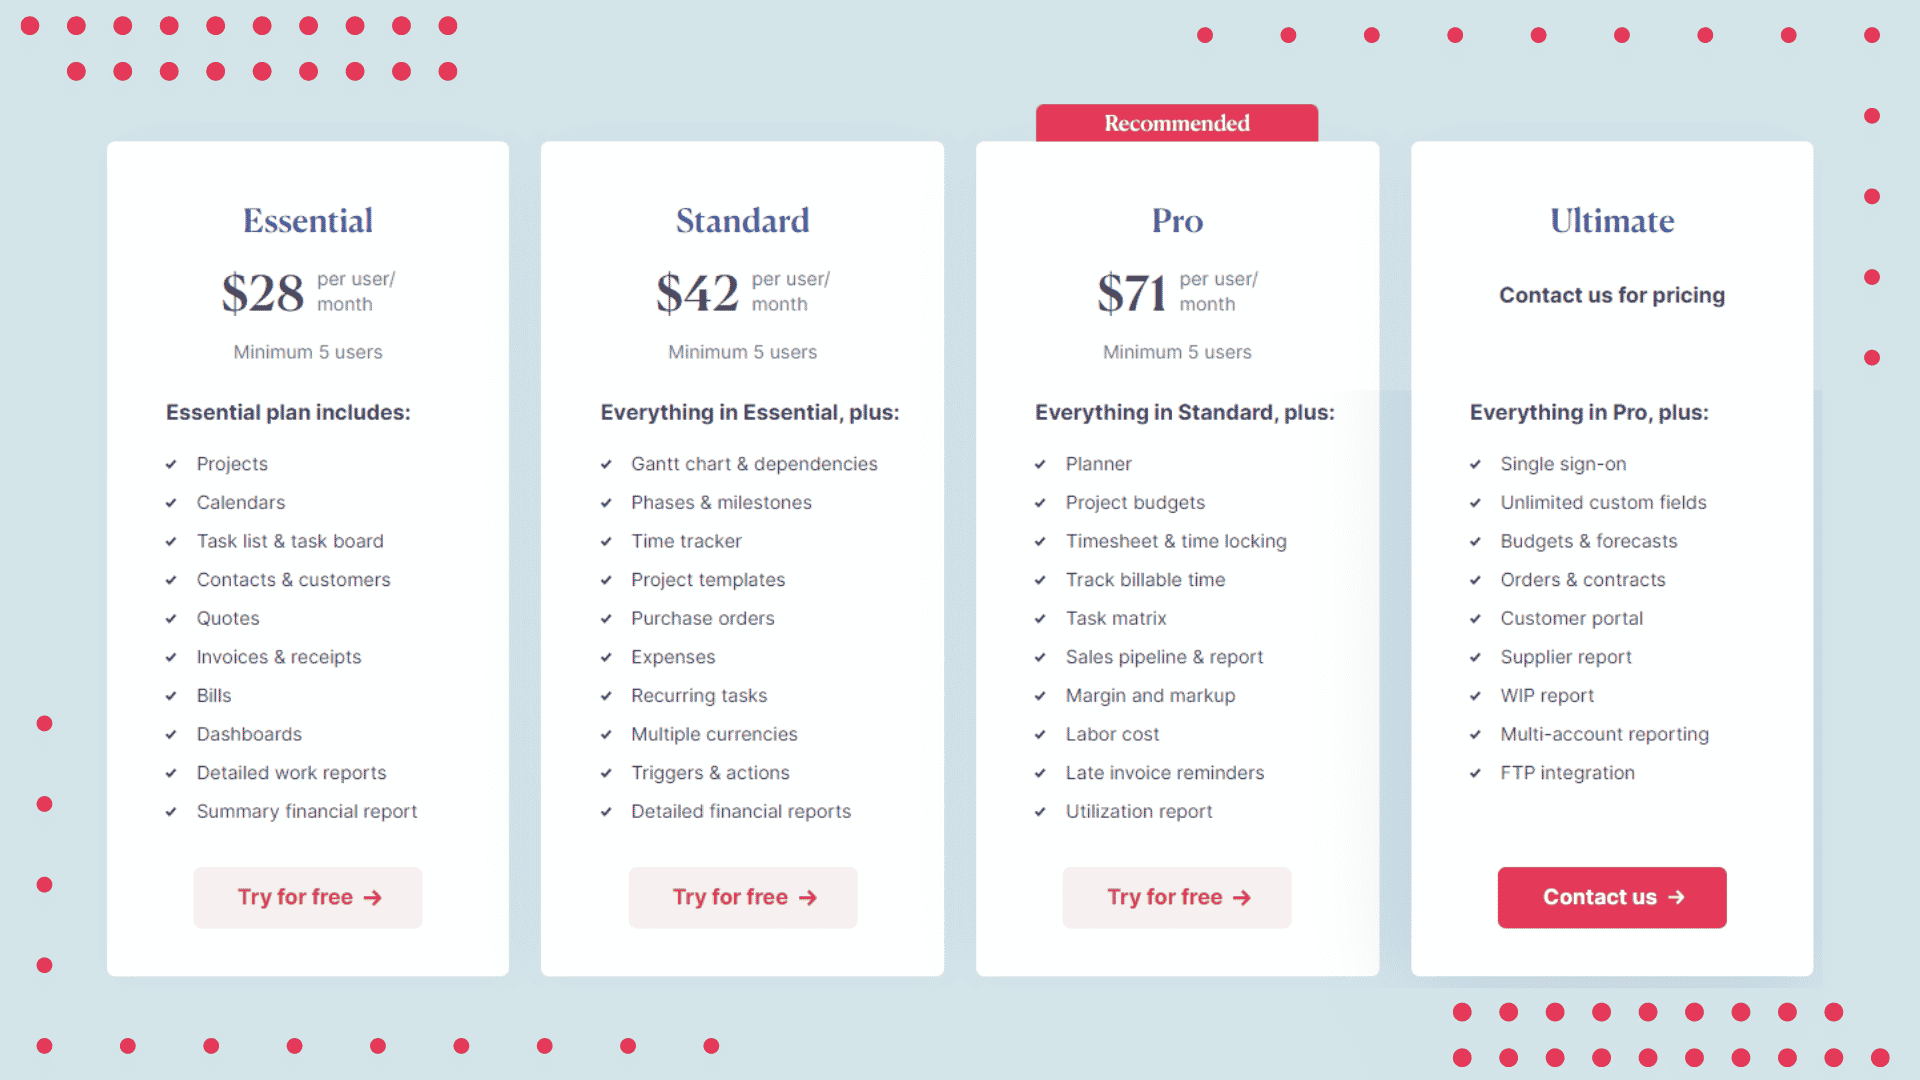
Essential - $28 per user/month| Minimum 5 users
Standard - $42 per user/month| Minimum 5 users
Pro $71 per user/ month| Minimum 5 users
Ultimate - Need to Contact the Support
Salesforce
Salesforce is a cloud-based CRM software enabling businesses to manage customer relationships more effectively. It provides a platform for sales and marketing teams to collaborate and track their progress and a range of features to help businesses automate their processes and improve customer service.
Nick's Take
Salesforce helps your marketing, sales, commerce, service, and IT teams work as one from anywhere. Salesforce is a compelling CRM platform that can help you manage your customers better.
Features:
Salesforce provides several features that can be used to improve how businesses manage their customer relationships. These include:
- Lead management: Salesforce can capture, track and follow up on leads more effectively.
- Opportunity management: The software can track opportunities through the sales pipeline and monitor progress towards targets.
- Account management: Salesforce can be used to store information about customers and prospects and track interactions with them.
- Contact management: The software can store contacts' information, including contact details, communication history, and notes.
- Task management: Salesforce can be used to create and assign tasks, set deadlines, and track progress towards completion.
Pricing:
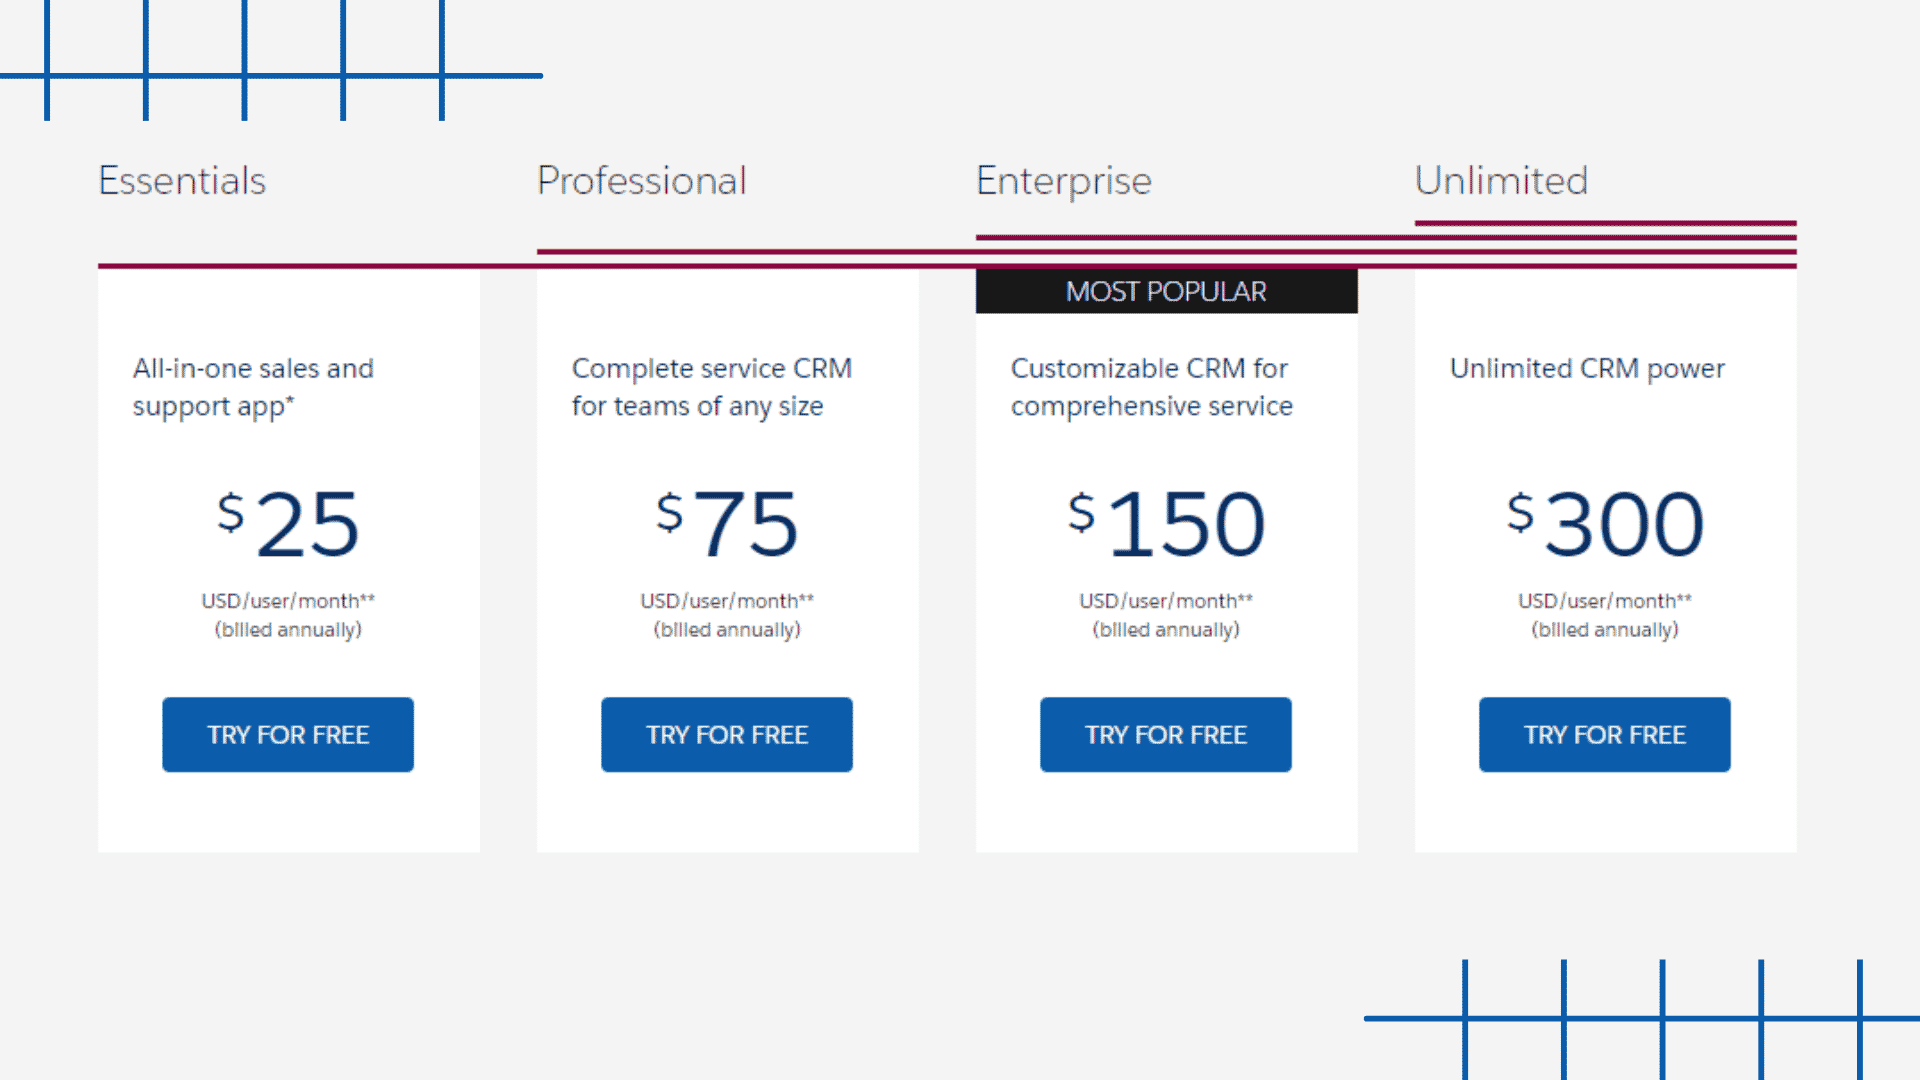
Essentials - All-in-one sales and support app* - $ 25 USD/user/month** (billed annually)
Professional - Complete service CRM for teams of any size - $75/user/month* (billed annually)
Enterprise - Customizable CRM for comprehensive service - $ 150 USD/user/month* (billed annually) - MOST POPULAR
Unlimited - Unlimited CRM power - $ 300 - USD/user/month* (billed annually)
Smartsheet
Smartsheet is a cloud-based project management and collaboration tool that enables users to work together on projects of all sizes. It offers a variety of features, including task management, Gantt charts, file sharing, and real-time updates. Smartsheet is suitable for businesses of all sizes and industries.
Nick's Take
Smartsheet is a platform that helps you manage projects, automate processes, and scale up to enterprise-level programs and portfolios. It offers a rich set of views, workflows, reports, and dashboards to capture and track your plans, resources, and schedules.
Features:
Smartsheet offers a variety of features to help users manage their projects effectively. These include task management, Gantt charts, file sharing, and real-time updates.
Task management features allow users to create and track tasks, set deadlines, assign resources, and monitor progress.
Gantt charts help users visualize project timelines and track progress. File sharing allows users to share files with team members and clients.
Real-time updates provide users with the latest information on project progress.
Pricing:
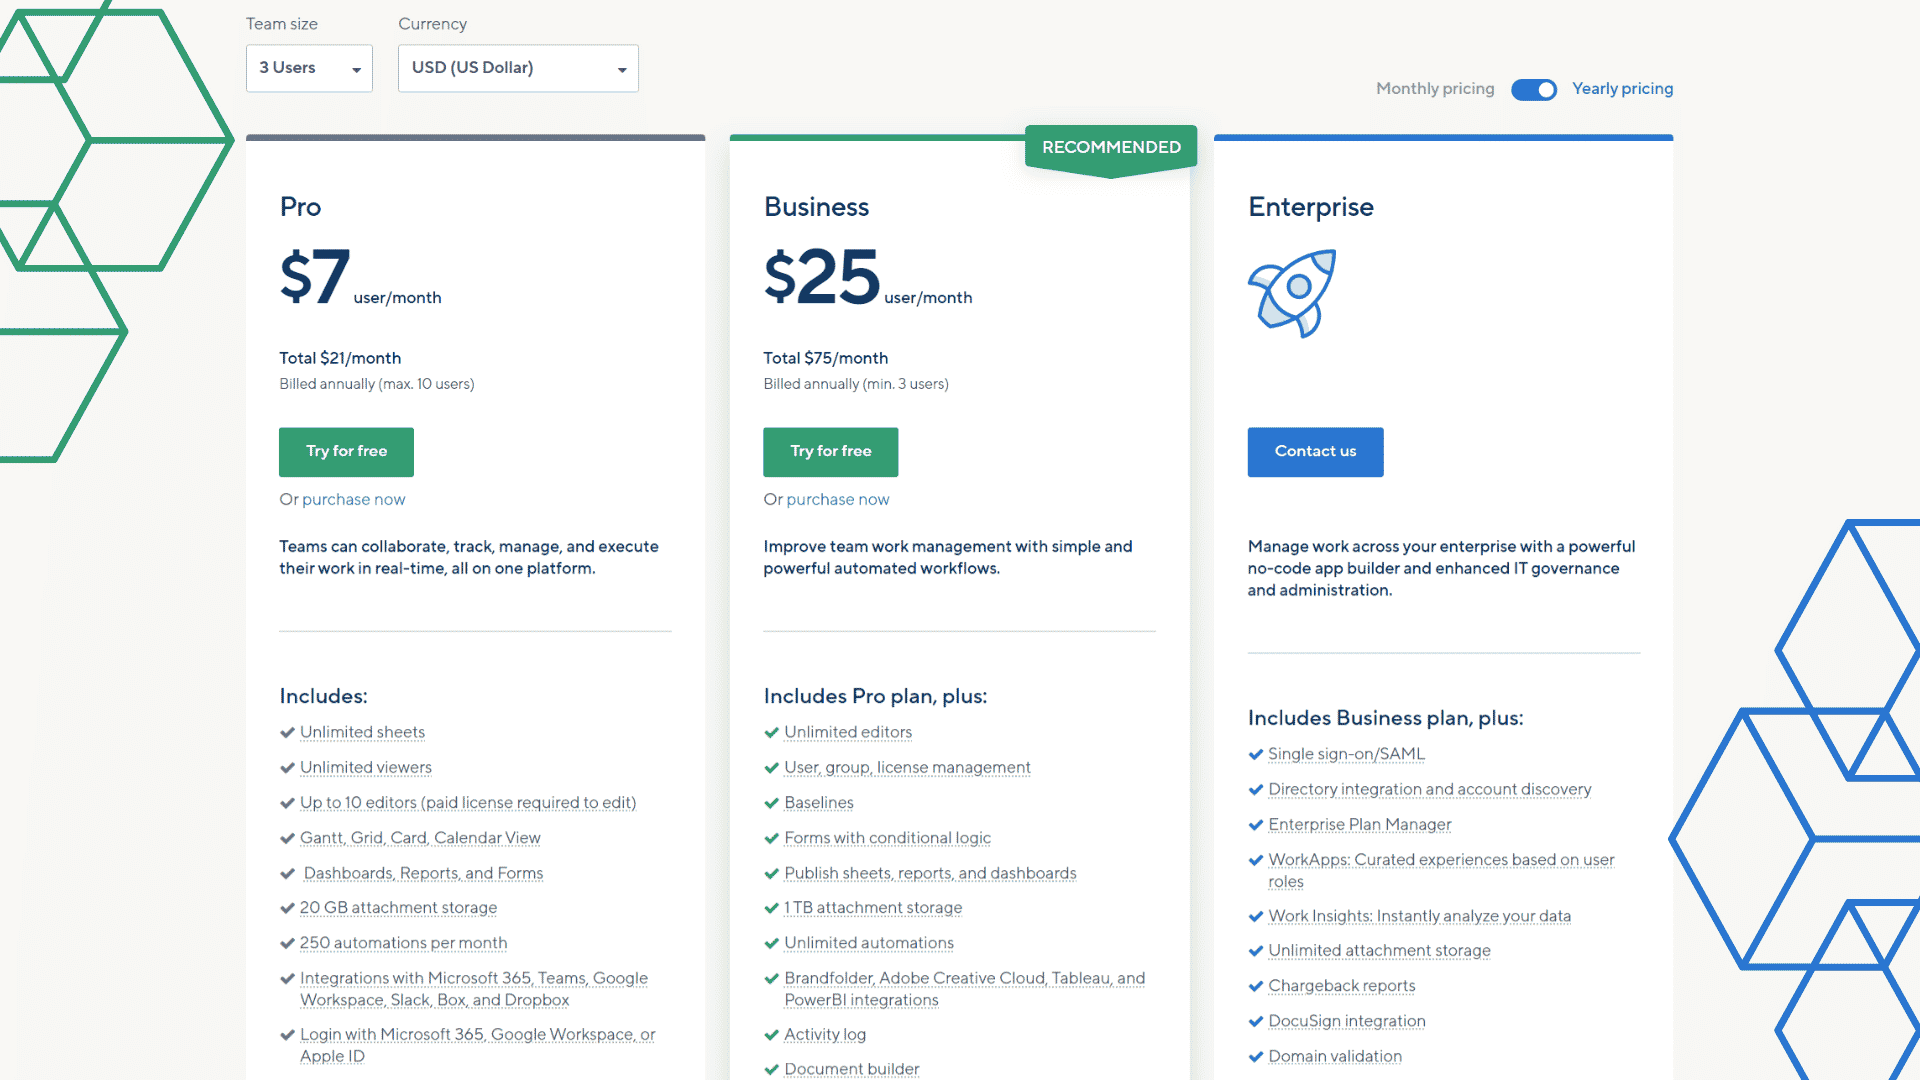
Smartsheet offers a free trial for new customers. After the free trial ends, pricing starts at $10 per month for the Basic plan and goes up to $25 per month for the Enterprise plan.
Domo
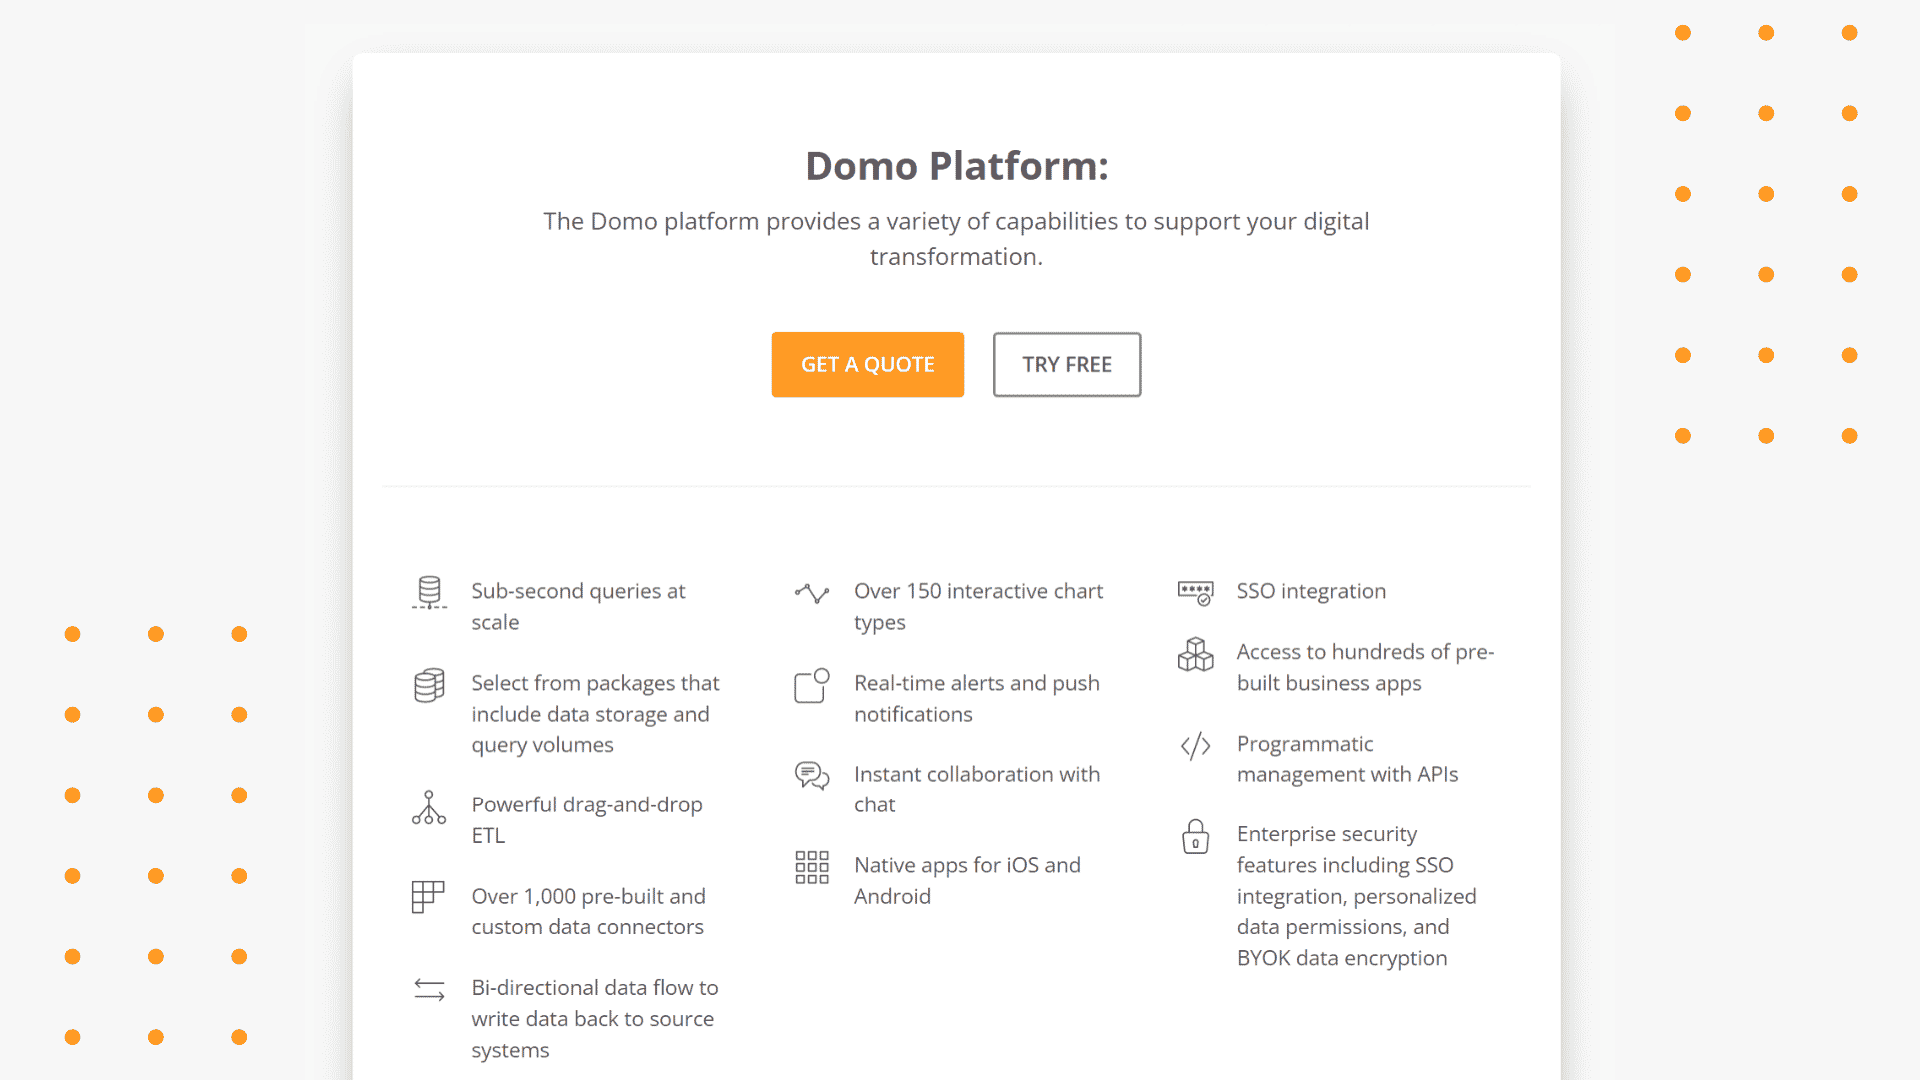
Domo is a cloud-based business intelligence and data visualization platform that enables users to connect to various data sources, visualize and analyze data, and create interactive dashboards.
Nick's Take
Domo is a platform that allows everyone to drive action from data. Domo Business Cloud® will enable you to combine all your data and put it to work across any business process or workflow.
Features:
-Connect to multiple data sources
-Visualize data in various ways
-Create interactive dashboards
-Share dashboards with others
-Collaborate with others on dashboard development
-Receive real-time updates on dashboard activity.
Pricing:
Domo offers a free trial of its platform. After the trial expires, pricing starts at $25 per user per month for the Basic plan, $50 per user per month for the Professional plan, and $100 per user per month for the Enterprise plan.
Supermetrics
Supermetrics is a data analytics tool that allows users to collect, analyze, and report data from multiple sources.
Nick's Take
Supermetrics is designed for marketing professionals who want to quickly bring metrics and dimensions from their favorite marketing platforms into their go-to reporting, data visualization, data warehousing, or BI tool. With Supermetrics, you can figure out what is and isn't working in your business and get straight into optimization
Features:
-Allows users to connect to multiple data sources and collect data in one place
-Offers a variety of reports and dashboards that can be customized
-Integrates with Google Sheets, Data Studio, and other BI tools
-Has a free version with limited features and paid plans starting at $49/month
Pricing:
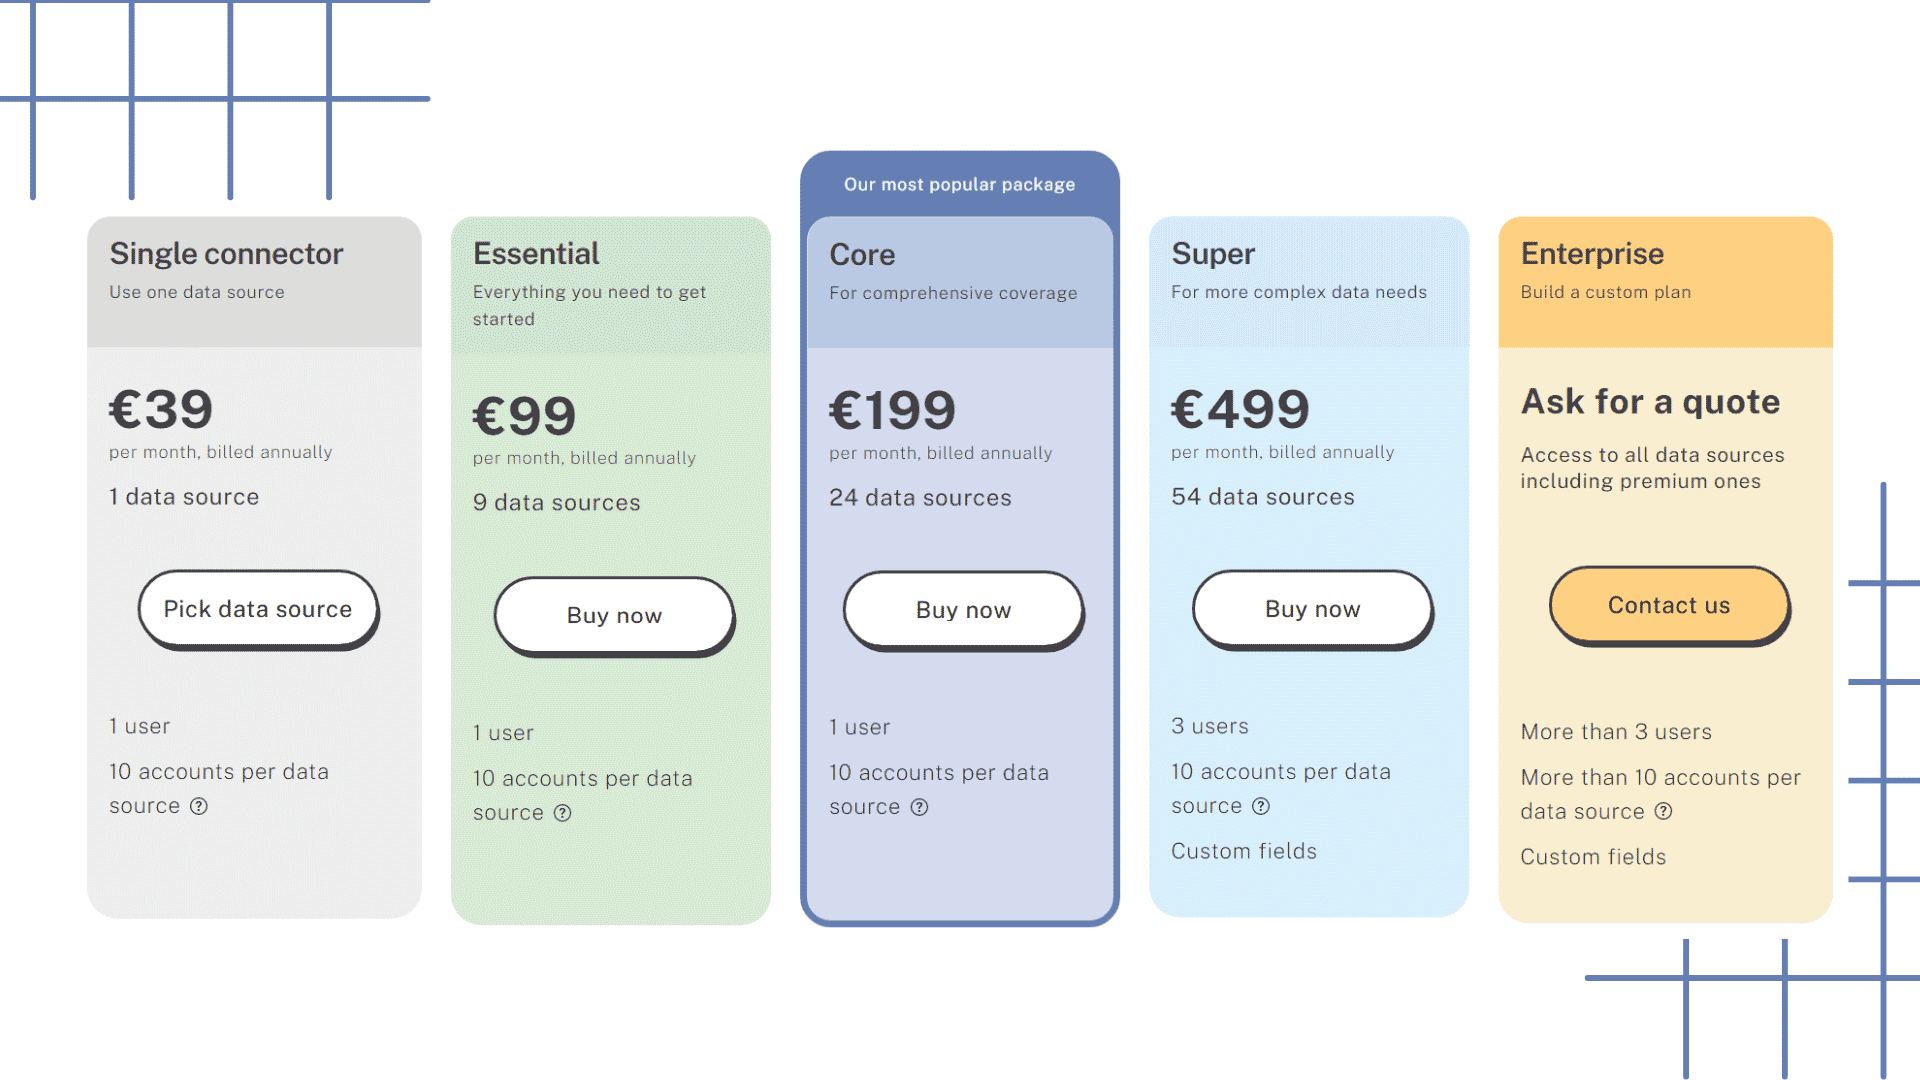
Supermetrics offers a free 14-day trial. After the trial, pricing starts at $49/month for up to 5 data sources.
SimpleKPI
SimpleKPI is a cloud-based key performance indicator (KPI) software that helps businesses measure, track and improve their performance. It comes with a range of features to help users set goals, track progress and identify areas for improvement.
Nick's Take
SimpleKPI is a platform that makes KPI tracking and reporting more accessible for businesses. The KPI dashboard software focuses on ease of use and colorful visuals to get more value from your data without the hassle of a steep learning curve.
Features:
- Set goals and target values for KPIs
- Track progress over time with graphs and charts
- Identify areas for improvement with customizable reports
- Share KPIs with team members or clients via email or export to PDF/Excel
- Integrates with popular business apps such as Salesforce, Google Analytics, and Quickbooks Online
Pricing:
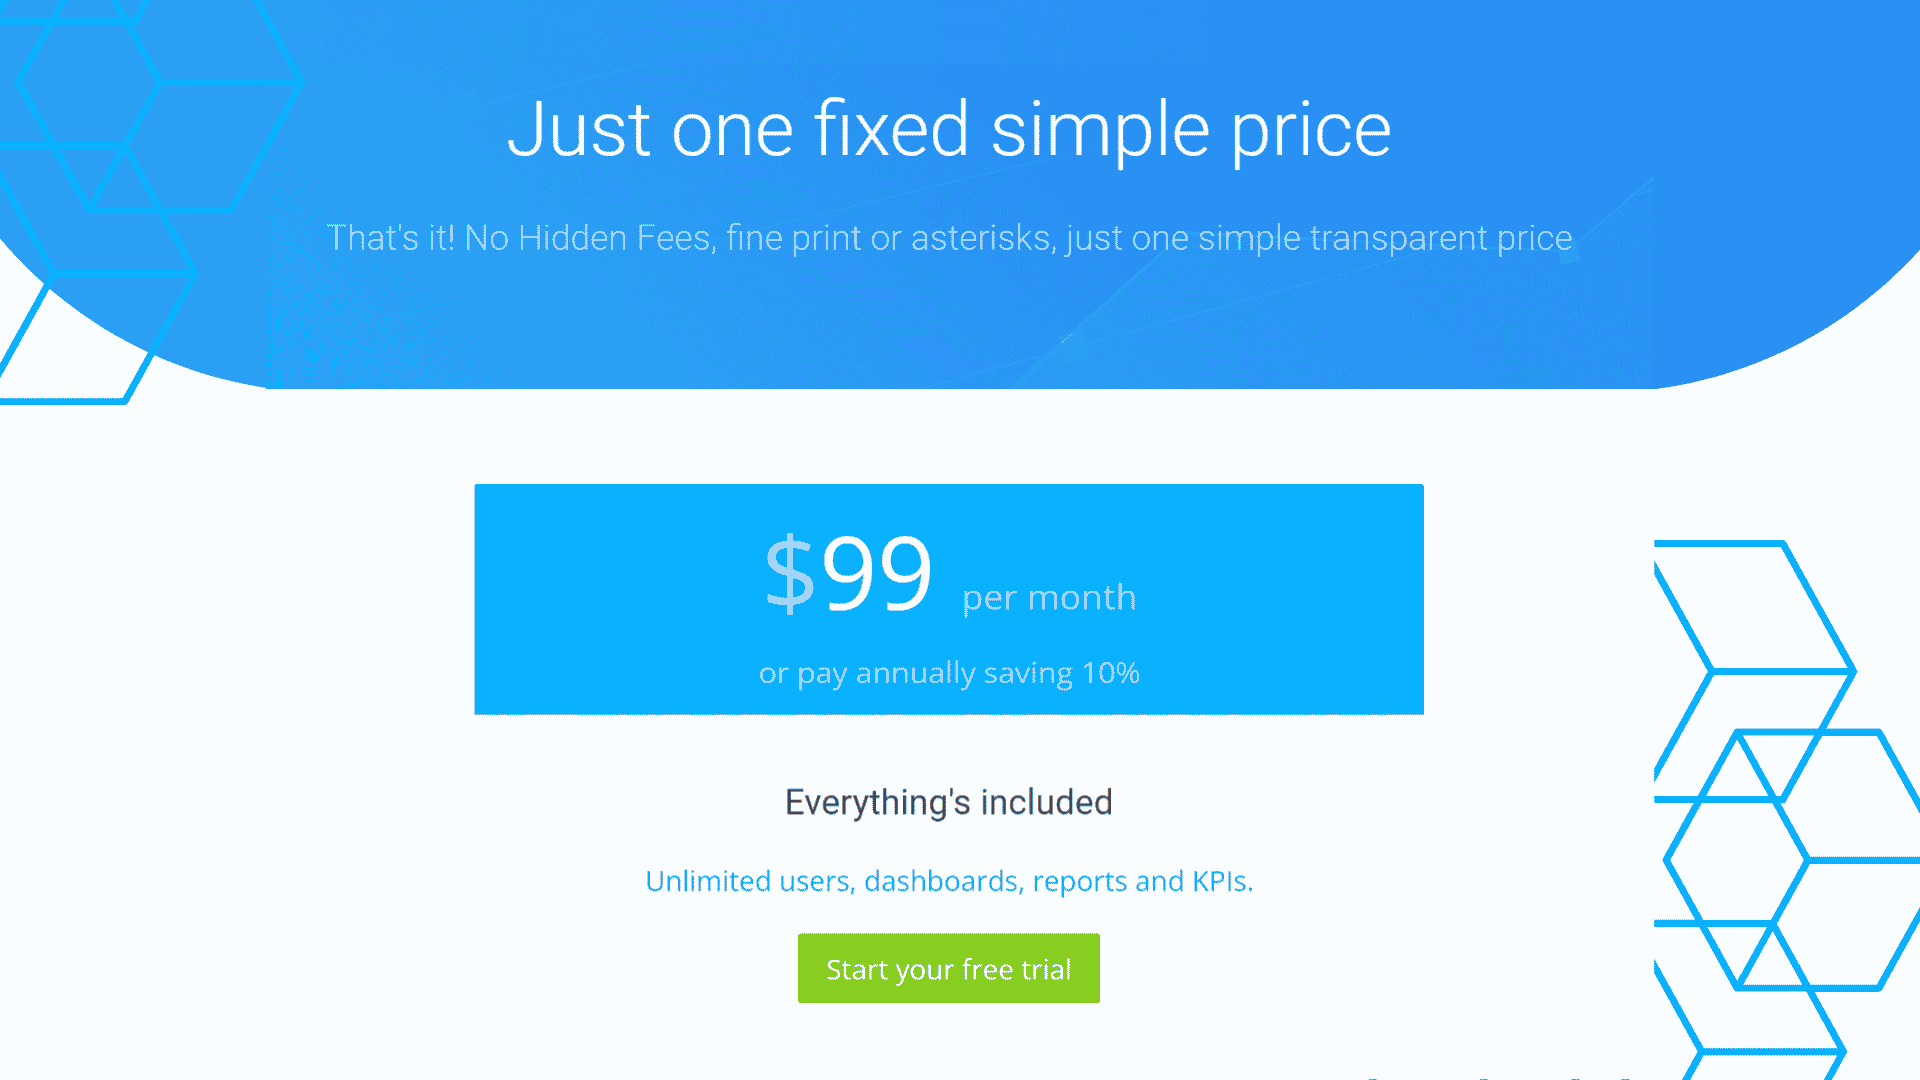
SimpleKPI offers a free 14-day trial. After the trial, pricing starts at $19/month for the Basic plan, which includes up to 5 users. The Professional plan costs $49/month and includes up to 10 users, while the Enterprise plan is priced at $99/month for up to 25 users.
Databox
Databox is a business intelligence and data visualization tool that helps you track, analyze, and report on your most important KPIs. It offers a customizable dashboard that lets you see all your KPIs in one place, as well as real-time alerts and reporting. Databox also integrates with over 500 business apps, so you can quickly get started with tracking your KPIs.
Nick's Take
The Dashboard Designer makes it easy to customize the look and presentation of dashboards. Databox integrates different data sources to give you a complete view of your performance.
Features:
- Customizable dashboard
- Real-time alerts and reporting
- Integration with over 500 business apps
-Tracking: Databox lets you track any metric or KPI from any data source, including Google Analytics, Salesforce, Facebook Ads, and more.
-Analysis: Databox provides powerful analysis features to help you make sense of your data. You can create custom reports, set up alerts, and more.
-Visualization: Databox makes it easy to visualize your data with customizable dashboards and charts.
-Reporting: Databox lets you share your dashboards and reports with colleagues or clients. You can also schedule messages to be sent automatically.
Pricing:
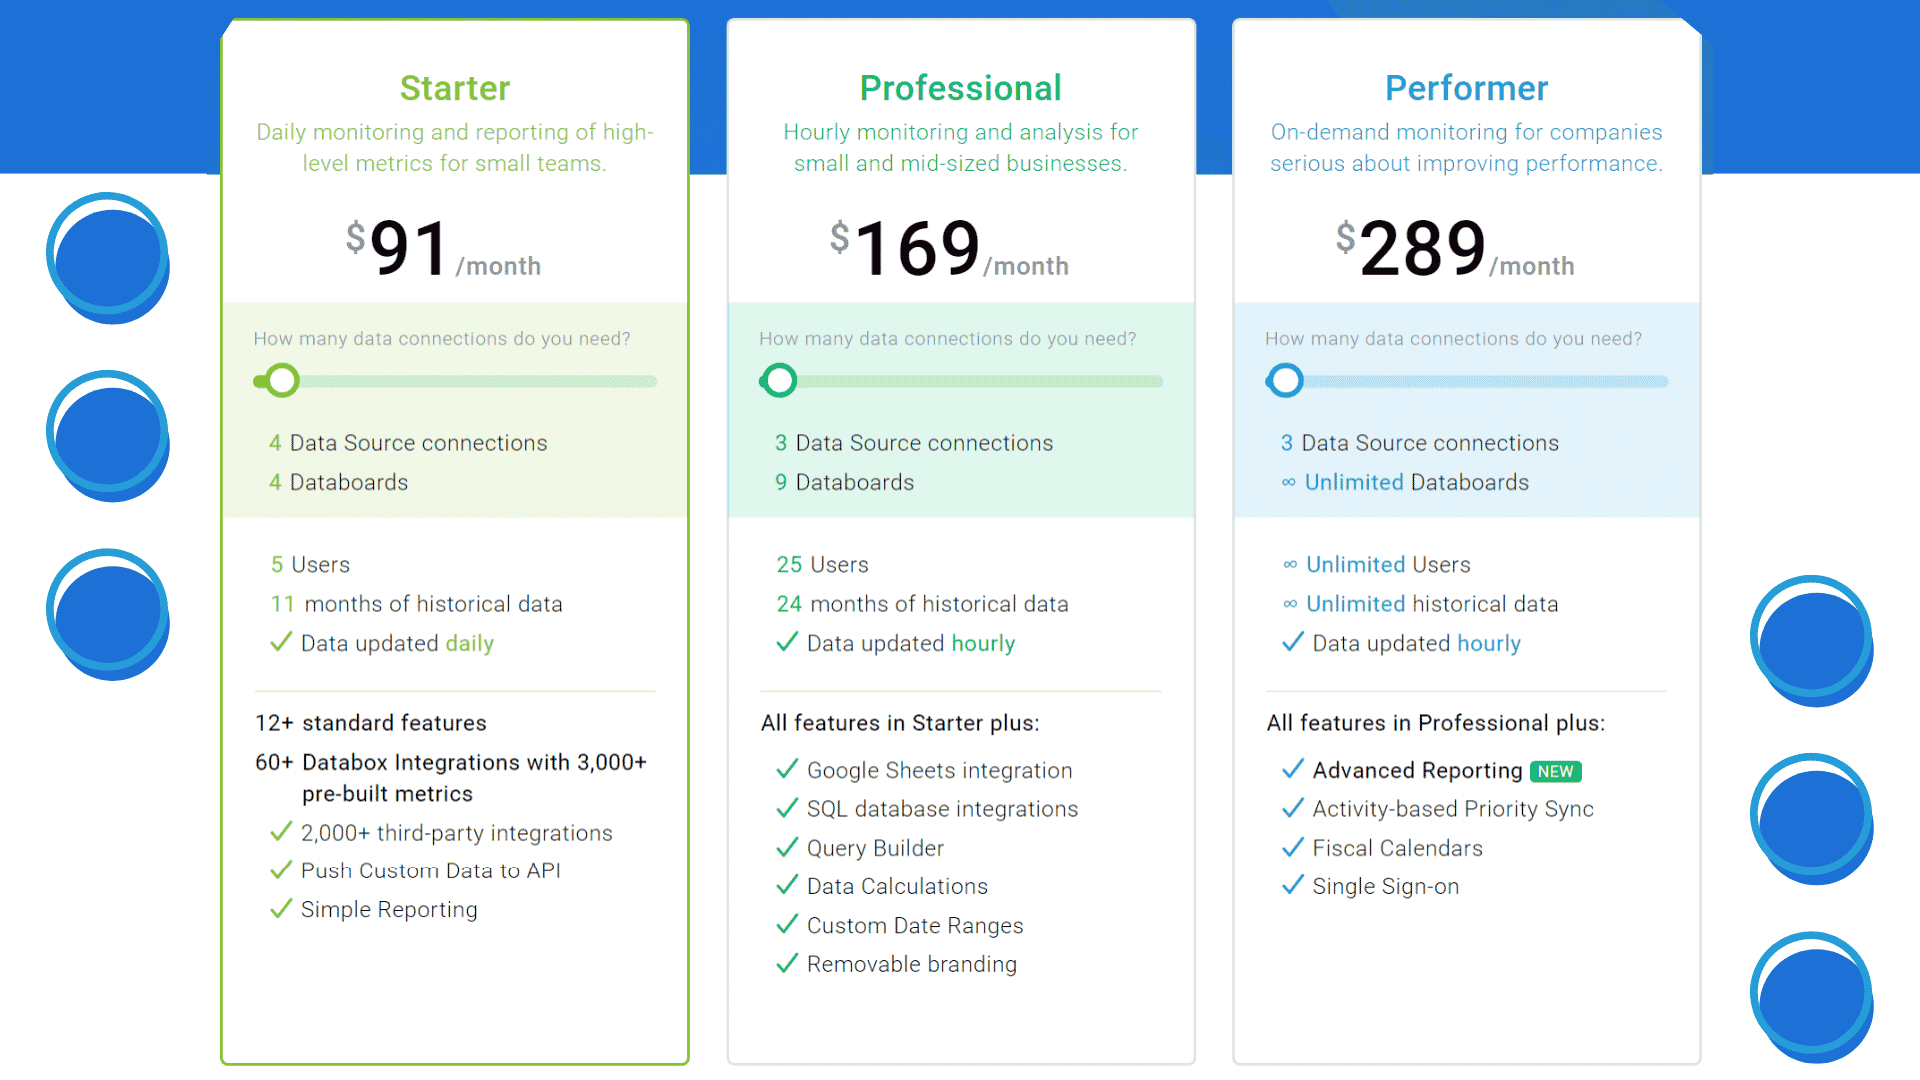
Databox has a free and paid plan for personal use, starting at $99/month for businesses.
Cyfe
Cyfe is an all-in-one business intelligence and analytics platform that helps businesses track, monitor, and visualizes data from multiple sources. It offers a drag-and-drop interface for creating custom dashboards and comes with pre-built widgets for popular data sources such as Google Analytics, Salesforce, Facebook, Twitter, and more.
Nick's Take
Cyfe is software that allows you to monitor and visualize your business on one easy-to-use, real-time dashboard. Cyfe has pre-built Dashboard Templates that enable you to connect your data and start watching your KPIs.
Features:
-Cyfe has many features to help businesses track, monitor, and visualize data.
-Custom dashboard builder: Cyfe offers a drag-and-drop interface for creating custom dashboards. Users can add multiple widgets to their dashboard and customize them as needed.
-Pre-built widgets: Cyfe has pre-built widgets for popular data sources such as Google Analytics, Salesforce, Facebook, Twitter, and more. These widgets make it easy to get started with visualizing data from these sources.
-Data export: Cyfe allows users to export their data into CSV or JSON format for further analysis in other tools.
-Cyfe is an all-in-one business intelligence and analytics platform that helps businesses track, analyze, and visualize data from multiple sources. It offers a customizable dashboard that can be used to monitor key performance indicators (KPIs), track social media metrics, and more.
Pricing:
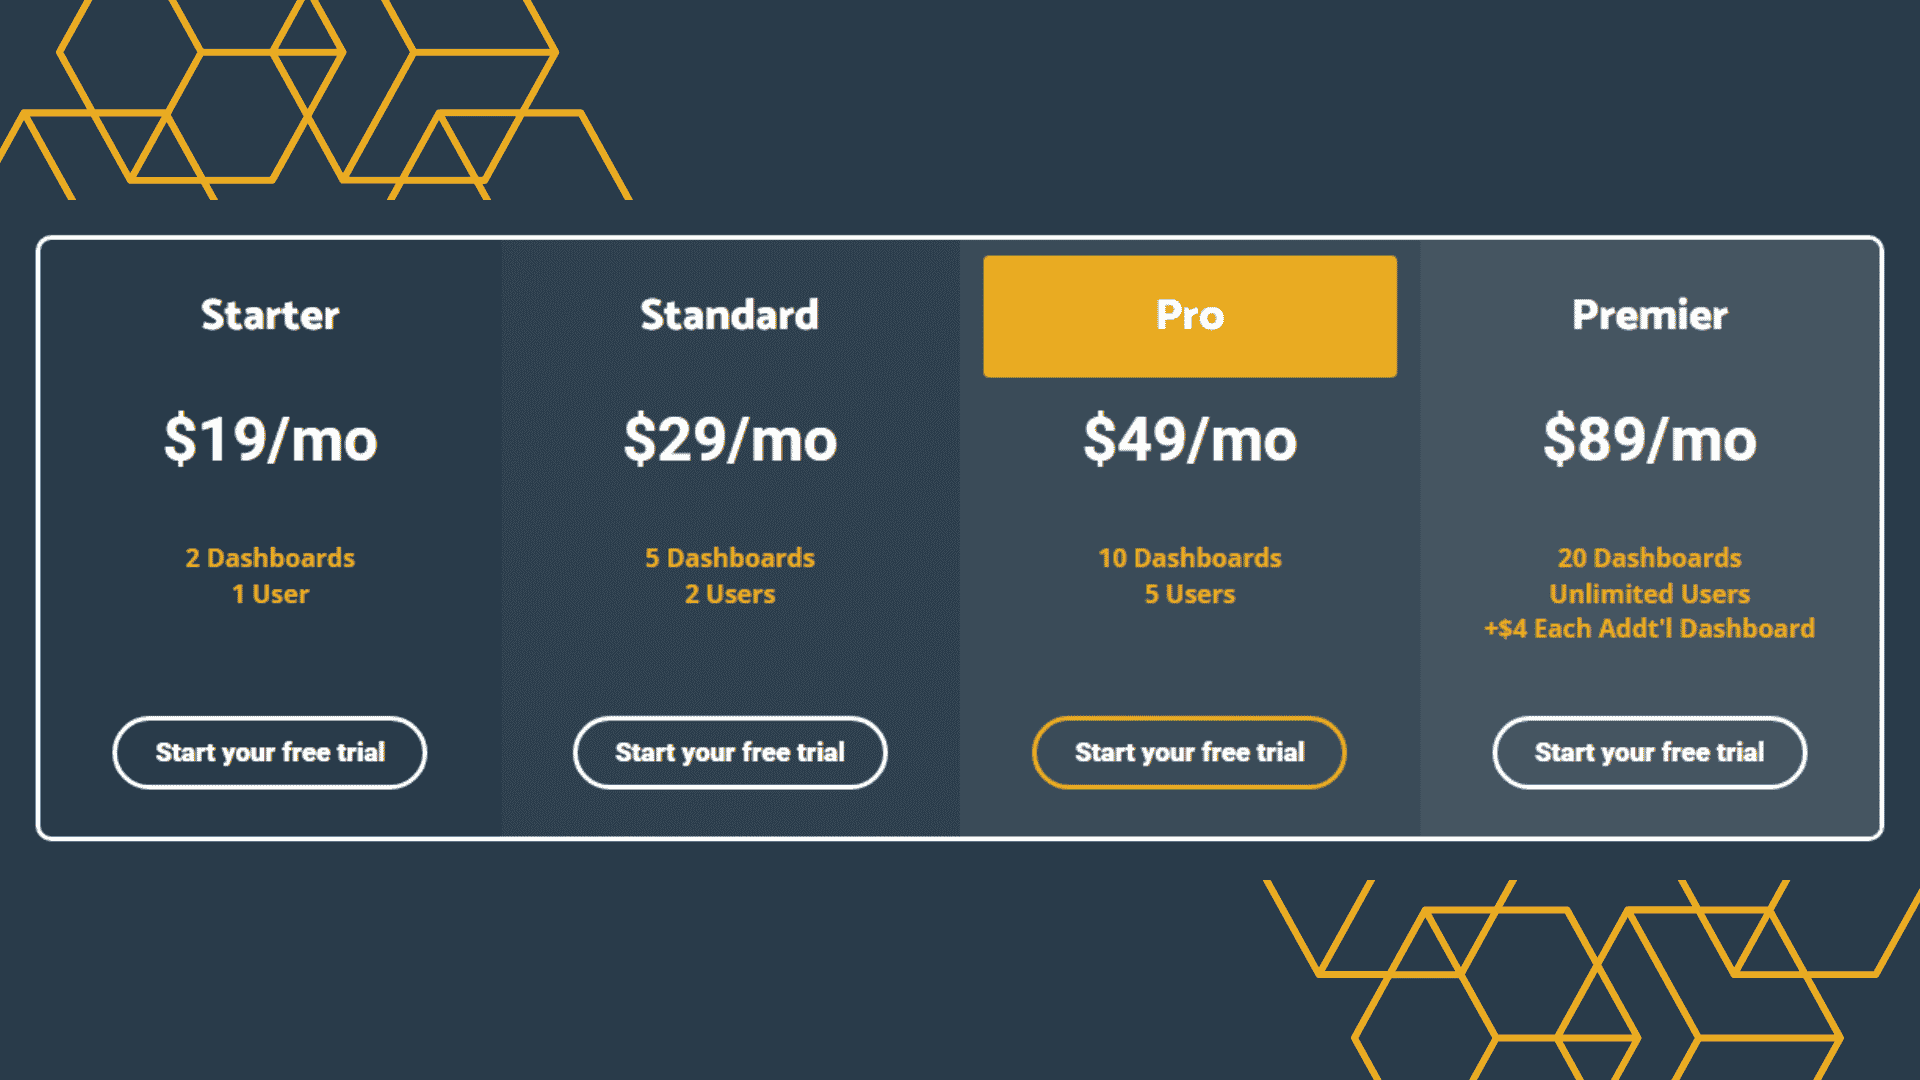
Cyfe offers a free plan for up to 5 users with limited features and paid plans starting at $19/month for up to 10 users with additional features such as custom branding and white label reports.
Grow
Grow is a cloud-based business intelligence and data visualization software that helps users track, analyze, and report their business data.
Nick's Take
The software allows users to connect, store, and blend data from hundreds of sources. It empowers everyone to explore data and build beautiful visualizations.
Features:
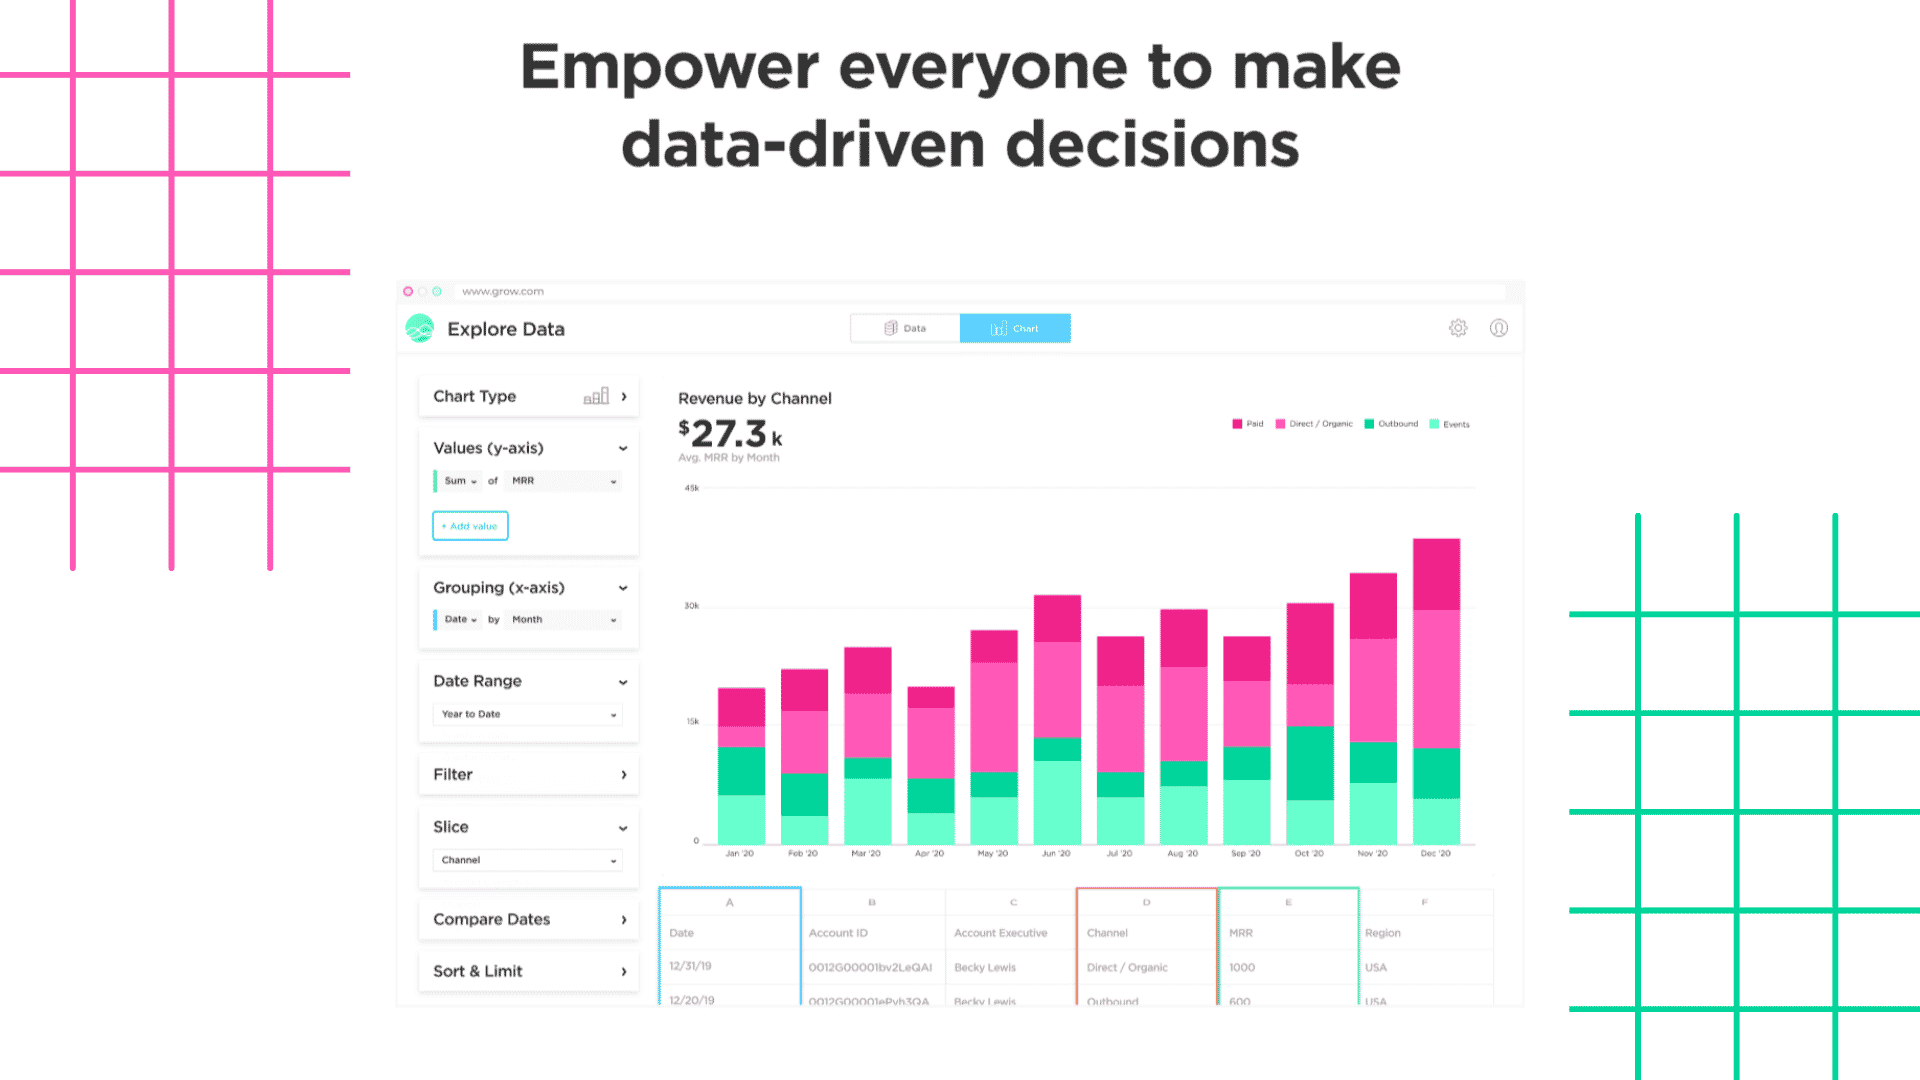
Grow offers a variety of features to help users visualize their data, including dashboards, reports, and data visualizations. Grow also offers several integrations with other business intelligence and data visualization tools.
Pricing:
Grow starts at $49 per month for the Basic plan, which includes 5GB of storage, 10 million rows of data, and support for up to 5 users. The Professional program starts at $99 per month and includes 10GB of storage, 50 million rows of data, and support for up to 10 users.
Freeboard
Freeboard is an open-source KPI software that allows users to create visualizations of their data. It is simple to use and has a wide range of features that make it a powerful tool for data analysis.
Nick's Take
Freeboard software allows you to build real-time, interactive dashboards and visualizations. Freeboard is production ready and has a secure, high-performance cloud system.
Features:
Freeboard has a wide range of features that make it a powerful tool for data analysis. It supports multiple data sources, including CSV, JSON, and SQL. It also offers a variety of visualization options, including line charts, pie charts, and bar charts. Freeboard allows users to create custom dashboards and share them with others.
-Allows for custom dashboard creation
-Can visualize data from various sources
-Has a plugin architecture that allows for further customization and functionality
-Is open source and free to use
Cascade is a cloud-based KPI software that helps businesses measure, track and improve key performance indicators (KPIs). The software provides users with customizable dashboards, reports, and alerts to help them stay on top of their KPIs. Cascade also offers a mobile app for tracking KPIs on the go.
Nick's Take
Cascade is a cloud-based KPI software that helps businesses track, measure, and improve their key performance indicators (KPIs). It offers a range of features, including real-time dashboards, goal setting, data export, and integration with popular business intelligence tools. Cascade is priced according to the number of users and starts at $9 per month for the basic plan.
Features:
- Customizable dashboards
- Reports and alerts
- Mobile app
- KPI library
- Data export
Pricing:
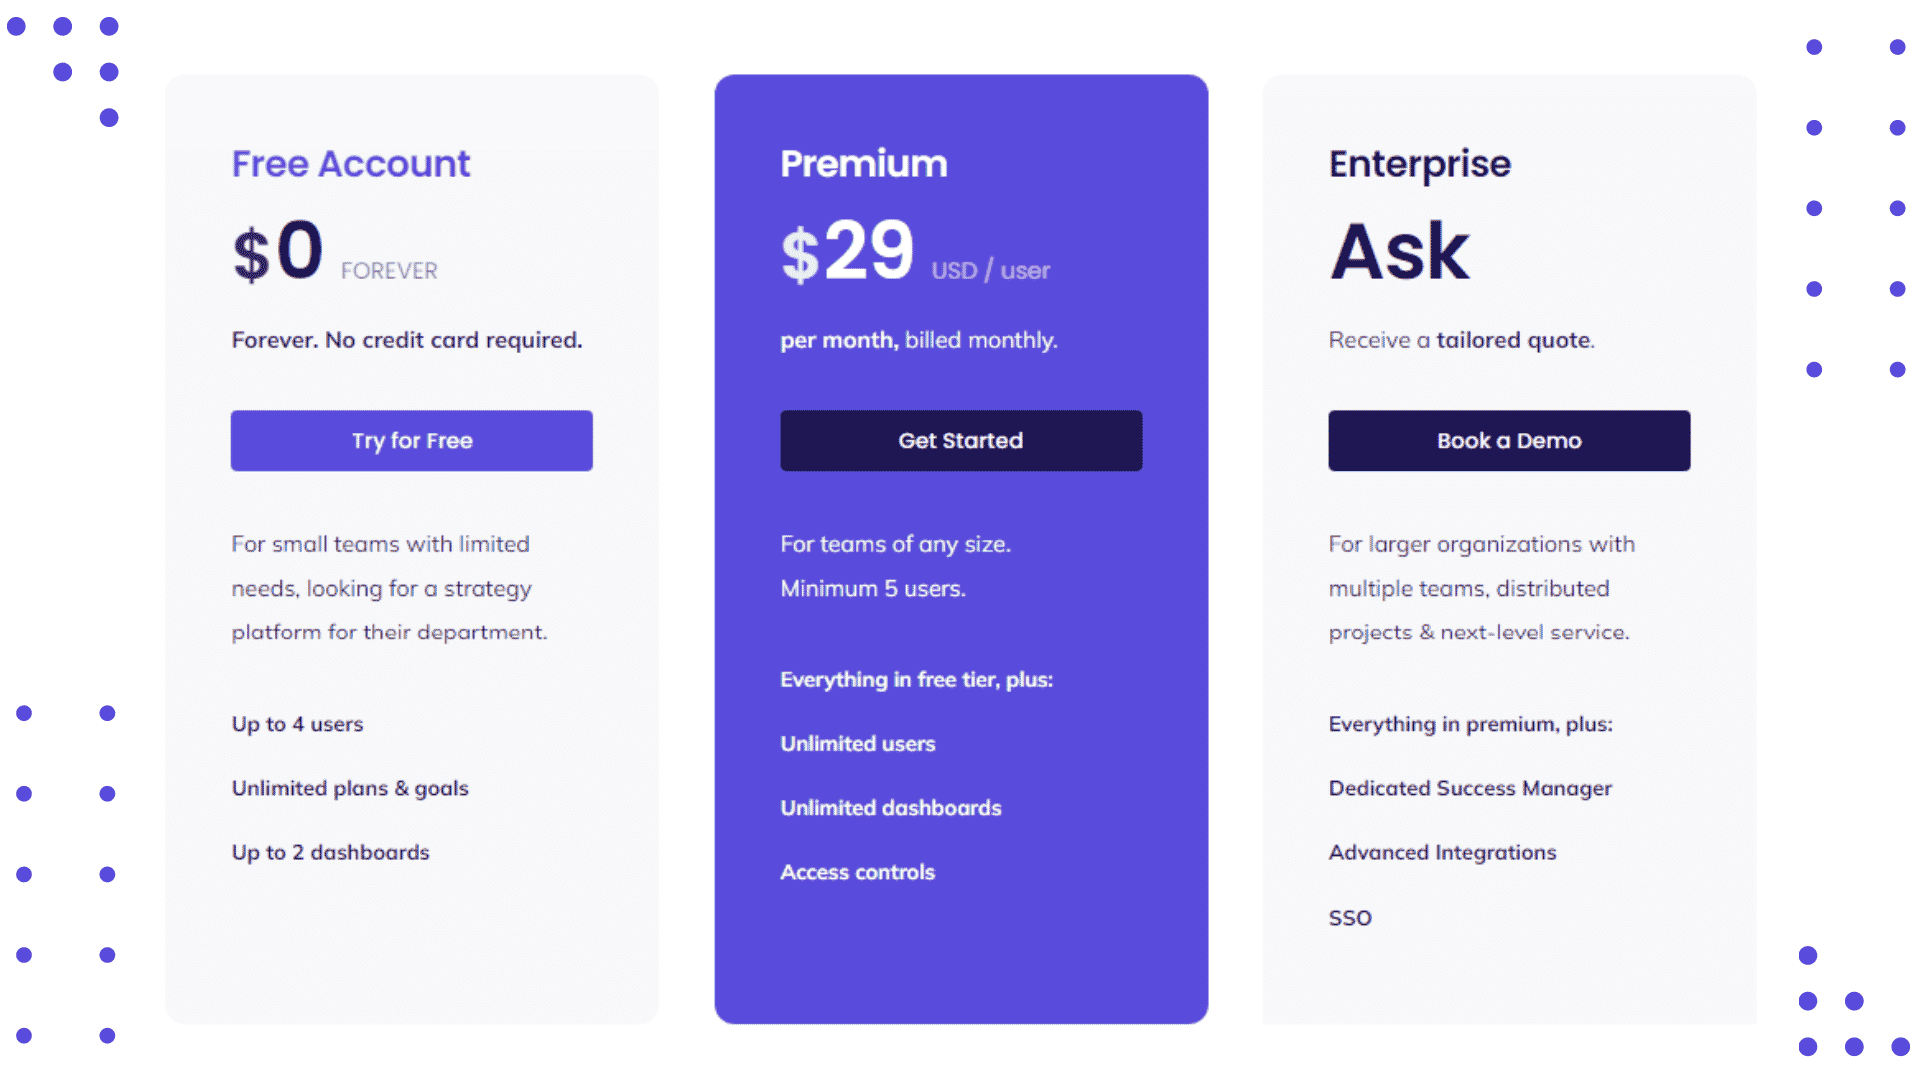
Cascade offers a free 14-day trial. After the trial, pricing starts at $49 per month for the Basic plan, which includes up to 5 users. The Professional plan costs $99 per month and includes up to 10 users. The Enterprise plan is priced at $199 per month and includes unlimited users.
Tableau

Tableau is a business intelligence and data visualization tool that helps people see and understand data. It can be used to create dashboards, charts, and other visualizations. Tableau is available in both a desktop and a server version.
Nick's Take
Tableau is a visual analytics platform that helps people see and understand data. Tableau has a community of millions of members worldwide who can connect and learn from each other.
Features:
-Data visualization
-Dashboard creation
-Interactive charts and graphs
-Real-time data updates
-Customizable reports
Pricing:
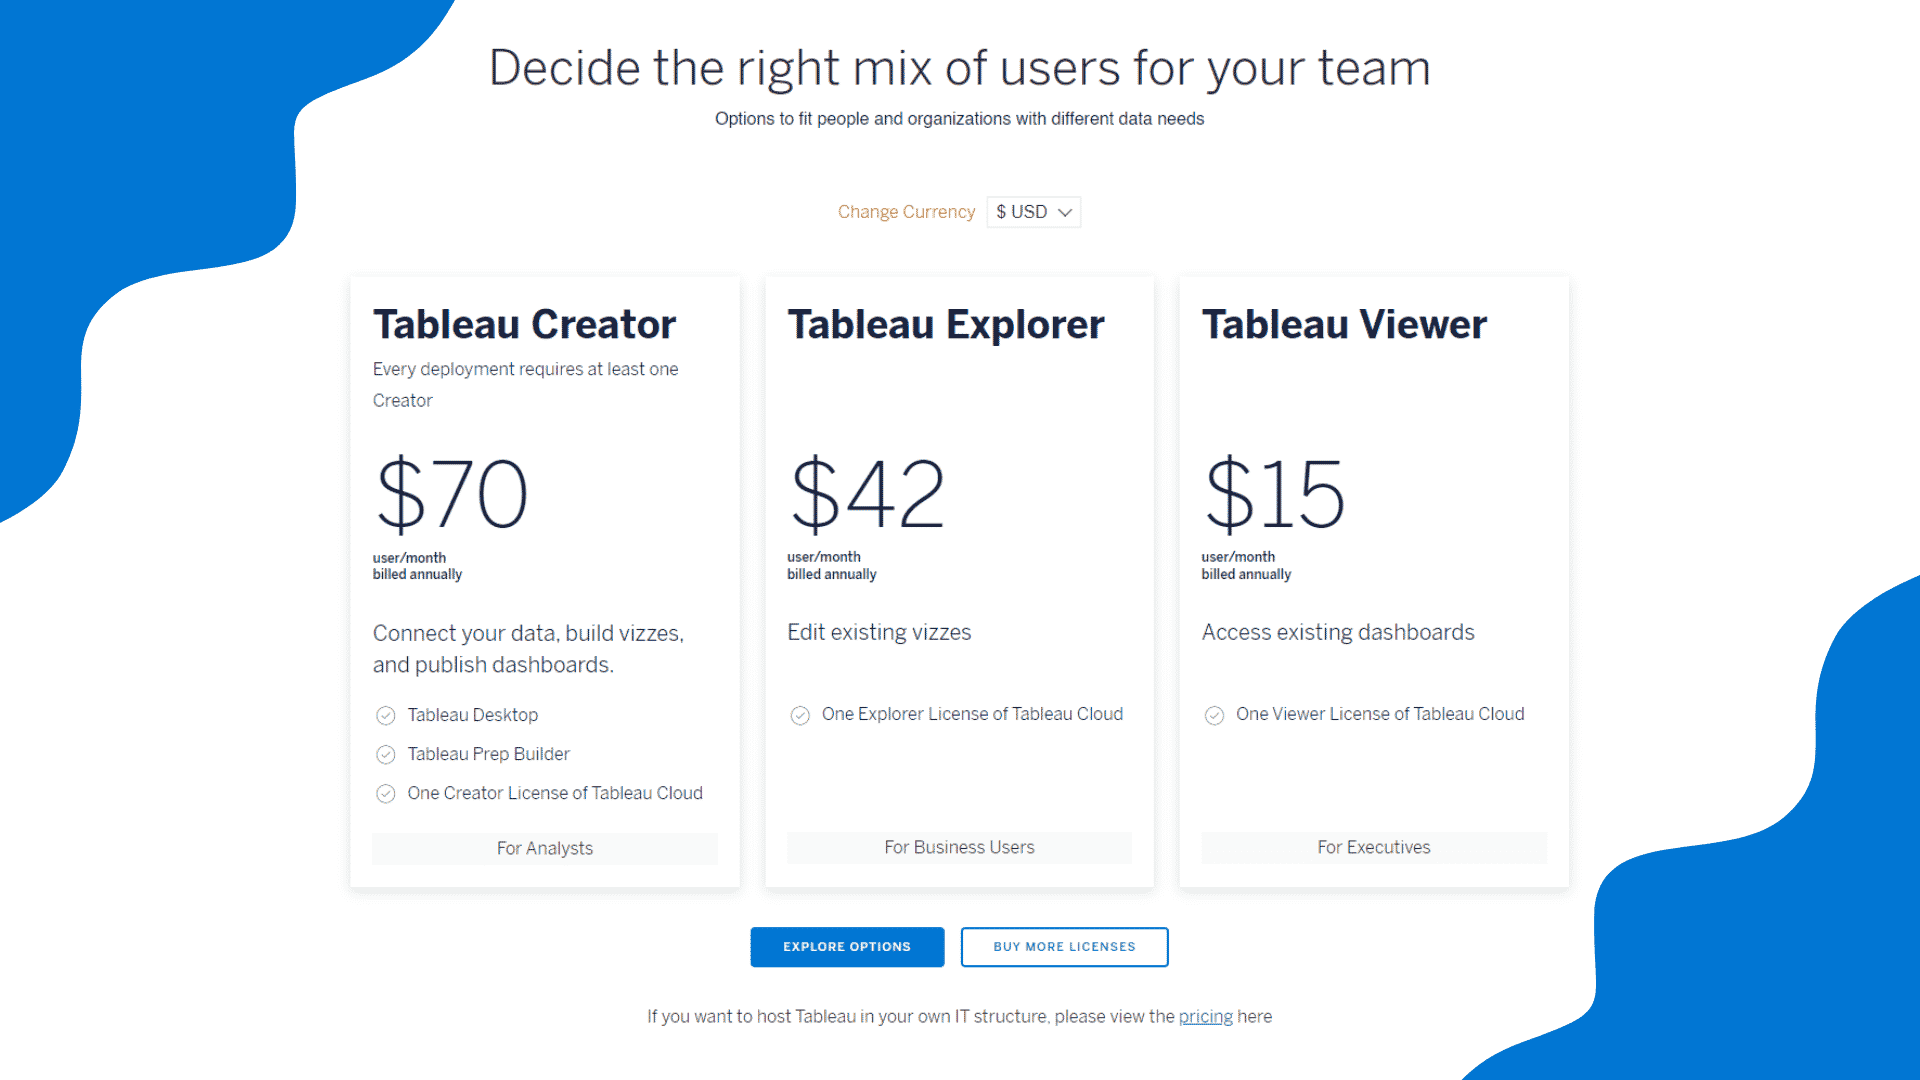
Tableau Desktop Professional Edition starts at $999 per user per year. Tableau Server starts at $3000 per server per year.
Adverity
Adverity is a data-driven marketing platform that enables users to collect, analyze, and visualize their marketing data in one place. The platform offers a suite of tools for managing campaigns, analyzing performance, and optimizing marketing spending. Adverity also provides users access to a team of data scientists who can help them make sense of their data and uncover insights that can improve their marketing efforts.
Nick's Take
Adverity is software that helps you connect and collect data from different platforms. It has easy-to-use tools that allow you to monitor, unify and clean your data.
Features:
-Data collection: Adverity offers a range of tools for collecting marketing data from multiple sources, including web analytics platforms, social media networks, and CRM systems.
-Data analysis: The platform provides users with powerful tools for analyzing their marketing data, including dashboards, reports, and visualizations.
-Data science: Adverity's team of data scientists can help users make sense of their data and uncover insights that can improve their marketing efforts.
-Campaign management: The platform provides users with tools for managing their campaigns, including budgeting, scheduling, and reporting features.
-Marketing optimization: Adverity's optimization engine enables users to optimize their marketing spend based on performance data.
Pricing:
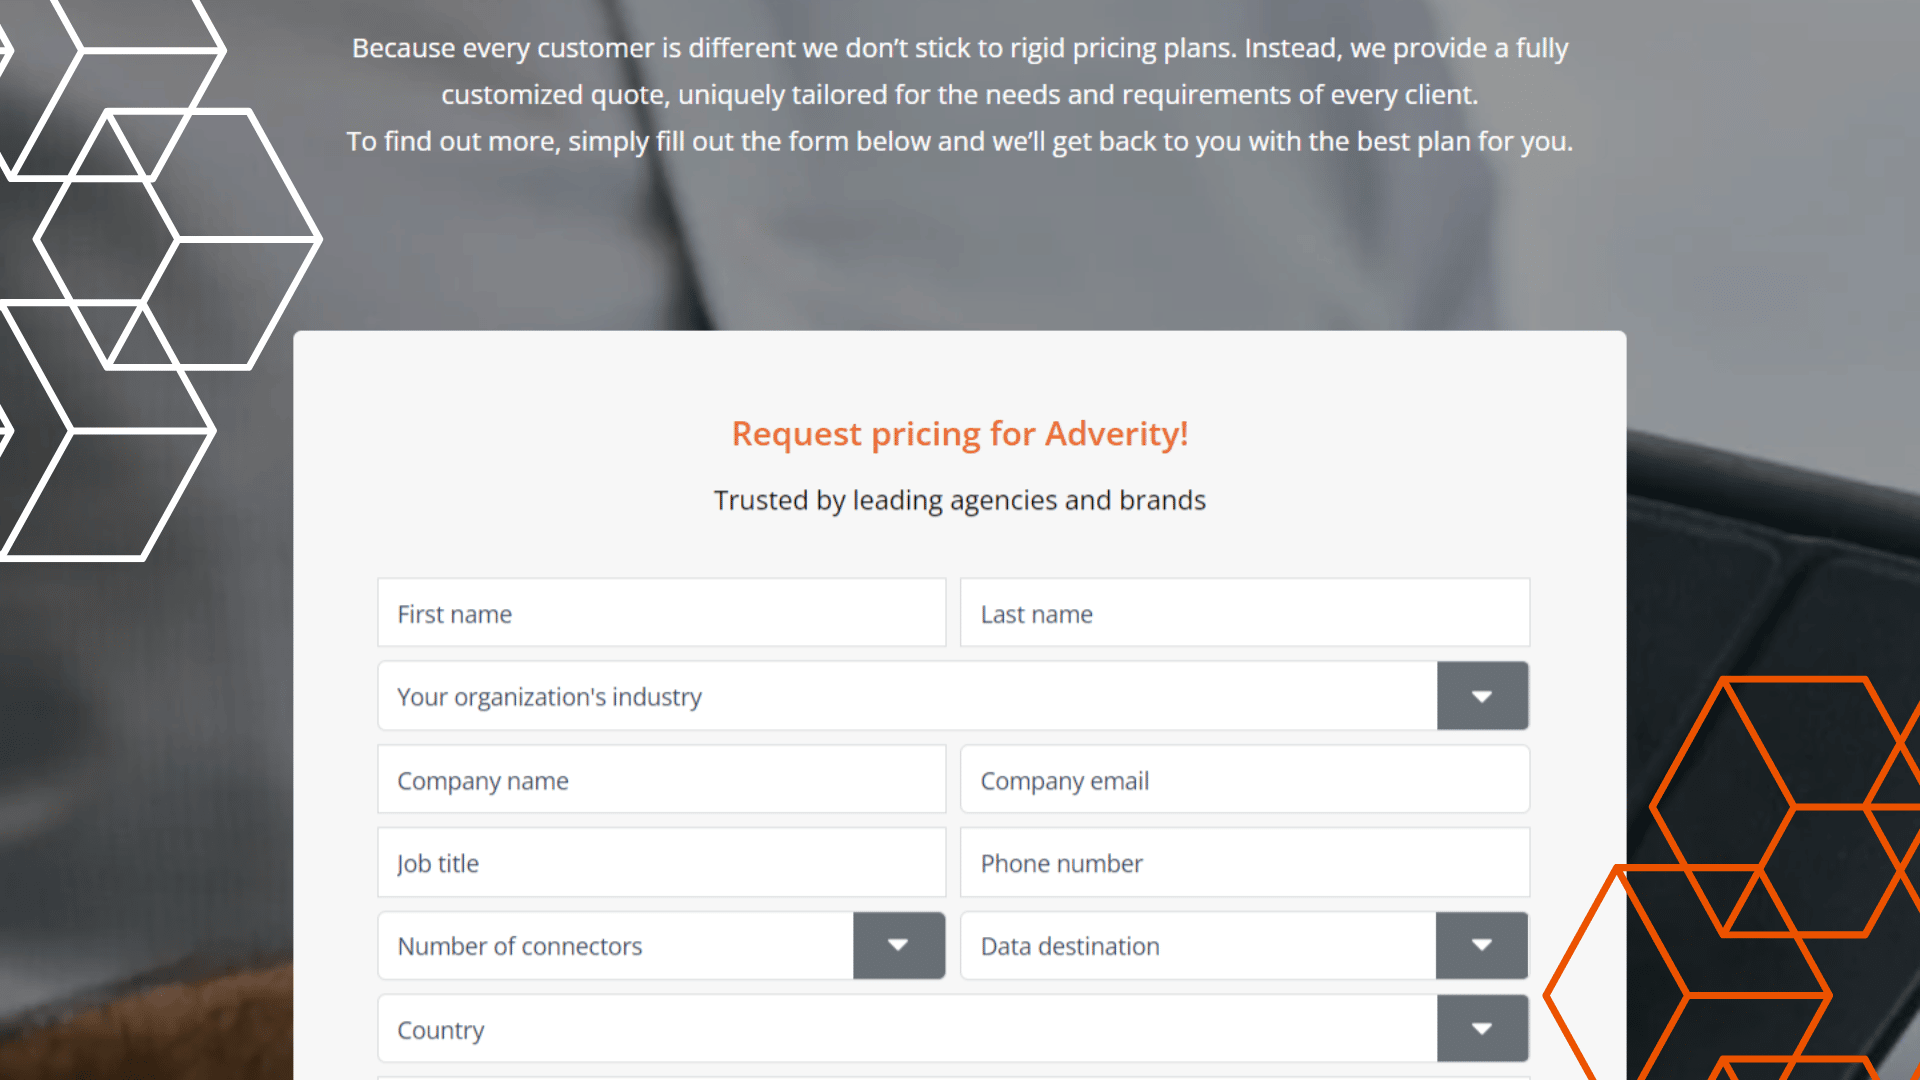
Adverity offers a range of pricing plans tailored to every client's needs and requirements. They only provide customized quotes.
Reveal
Reveal is a self-service embedded analytics solution that provides organizations with the most powerful, flexible, and transparently priced analytics tools on the market. It enables users to create data reports and dashboards easily.
Nick's Take
Reveal is a business intelligence solution that is purpose-built for embedded analytics. It is deployable to any public or private cloud or your on-premise servers.
Features:
-Allows users to create custom dashboards to visualize data
-Offers real-time alerts when KPIs are not being met
-Integrates with other business intelligence tools for more profound insights
-Helps users drill down into data to identify root causes of problems
-Enables collaboration between team members on KPI goals and progress
Pricing:
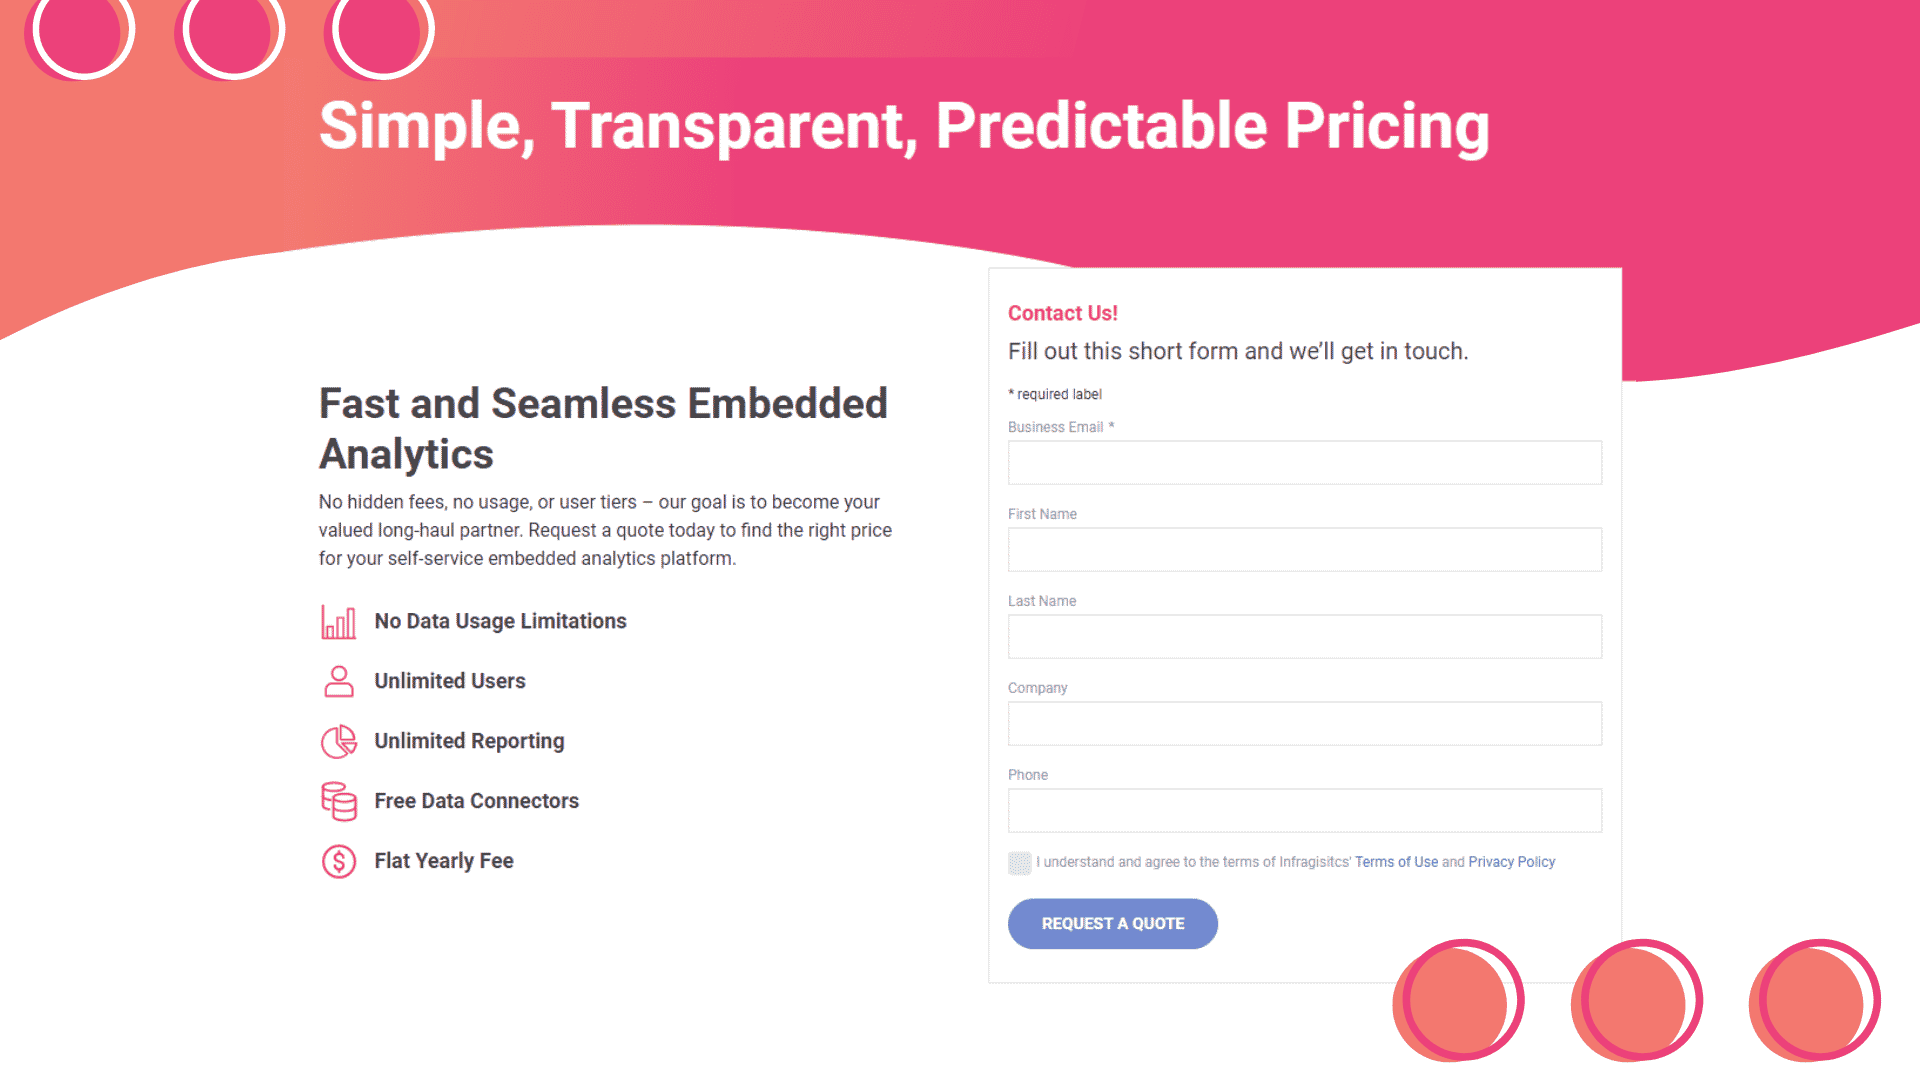
Reveal offers a premium plan with custom integrations and advanced features when you're ready to scale your partner program.
What are the benefits of using KPI software?
KPI software provides an easy way to track the progress of your business goals and objectives. This information can identify areas where improvements need to be made and gauge current strategies' success.
Improving decision-making: By having access to accurate and up-to-date data, you can make informed decisions about where to allocate resources and how to achieve your goals best.
Increasing transparency: KPI software can help increase transparency within your organization by providing visibility into performance data. This can help build trust between management and employees and improve communication.
Saving time: KPI software can save you time by automating the process of collecting and analyzing data. This allows you to focus on other aspects of running your business.
Reducing costs: KPI software can reduce the costs associated with manually tracking performance data. Additionally, this software often comes with various features that can save you money in the long run (such as automated reporting)
How to choose the best KPI software for your business?
You should consider a few factors when choosing KPI software for your business. First, think about what type of KPIs you want to track. Do you need to track financial KPIs, operational KPIs, or both?
Next, consider how much data you need to collect and analyze. Some software platforms are better equipped to handle large data sets than others. Make sure the venue you choose can control the data you need to work with.
Finally, think about how easy the software is to use. You don't want to spend hours figuring out how to use the platform or input your data. Look for software that is user-friendly and easy to navigate and has these features:
1. Ease of use: The software should be easy to use, with a user-friendly interface.
2. Functionality: The software should offer all the features and functions you need to track your KPIs effectively.
3. Price: The software should be affordable, with a price that fits your budget.
4. Customer support: The software should come with excellent customer support if you have any questions or problems using it.
5. Compatibility: The software should be compatible with your existing systems and infrastructure.
Other factors to consider
1. The type of business you have: What kind of data do you need to track?
2. The size of your business: Do you need enterprise-level features?
3. Your budget: How much can you afford to spend on KPI software?
4. The features you need: What kind of features are important to you?
5. Ease of use: How effortless is the software to use?
6. Support: What kind of support does the software offer?
7. Scalability: Can the software grow with your business?
What are the different types of KPI software?
This software is hosted on a remote server and can be accessed from any device with an internet connection. Pros: Accessible from anywhere, no installation required. Cons: It can be slower than desktop software and may need a monthly subscription.
Desktop KPI software: This software is installed locally on your computer. Pros: Usually faster than web-based software, can work offline. Cons: Requires installation, can only be used on one computer.
Mobile KPI software: This software is designed to be used on mobile devices such as smartphones and tablets. Pros: It can be used anywhere and often provides real-time data updates. Cons: It may have limited features compared to desktop or web-based versions.
KPI software that is accessed through a web browser.
How To Track KPIs?
1. Set your business goals
How to set goals:
When setting business goals, it is essential to keep KPIs in mind. KPIs can help you measure progress and determine whether or not you are meeting your objectives. There are a few things to keep in mind when setting goals:
1) Set realistic and achievable goals. Don't set yourself up for disappointment by setting unrealistic targets. Instead, focus on achievable objectives that will help you move closer to your long-term vision.
2) Make sure your goals are specific. Vague or general objectives are challenging to measure and track. Be as straightforward as possible when setting goals to identify whether or not you are making progress quickly.
3) Make sure your goals are relevant to your business strategy. Businesses often set goals that have no bearing on their overall strategy. This can lead to wasted time and resources chasing after irrelevant objectives.
4) Make sure your goal is time-bound. A goal without a deadline is just a wish. A timeline for achieving a plan will help you stay focused and on track.
2. Define your audience
Your target audience is those individuals who need to track KPIs to improve their business performance.
What are their needs?
Your target audience needs a system that will help them measure and track KPIs to identify improvement areas.
What are their pain points?
Your target audience's pain points may include not knowing how to track KPIs effectively or not having the time to do so.
3. Follow BI KPI tracking best practices
There are many different types of KPIs, but they all share some standard features:
1. KPIs are quantifiable measures. This means that they can be expressed as numbers, making them easy to track and compare over time.
2. KPIs are relevant to the goals of the organization or individual. This means that they should be aligned with what you're trying to achieve so you can use them to gauge your progress.
3. KPIs are actionable. This means you can use them to inform your decision-making and take steps to improve your performance if necessary.
4 What Are The Best Practices For Tracking KPIs?: There are a few best practices for tracking KPIs that can help you get the most out of this process:
4. Use a mix of real-time and historical data
What is real-time data?:
Real-time data is information that is delivered immediately after it is generated.
It allows organizations to make decisions and take action based on the most current information available.
For example, if a company wants to track how many visitors are on its website at any given moment, it would use real-time data.
What is historical data?:
Historical data refers to information that has already been collected and stored. It can be used to track trends over time or compare different periods. For example, if a company wants to see how its website traffic has changed over the past year, it would use historical data.
5. Use the right visualizations
Why track KPIs?
Organizations track KPIs to assess their progress toward meeting strategic objectives. Individuals may also track KPIs to monitor their performance.
How to track KPIs?
There are various ways to track KPIs. Organizations may use software applications or spreadsheets to capture data and calculate metrics. Individuals may also use personal tracking methods, such as writing down daily accomplishments in a journal.
What are some KPIs to track?
Some common organizational KPIs include productivity, profitability, customer satisfaction, and employee retention. Individual KPIs might focus on goal achievement, personal growth, or self-improvement.
6. Differentiate between KPIs and metrics
What is a metric:
A metric is a quantifiable measure that is used to track and assess the status of an organization, individual, or process.
How to choose KPIs:
There are a few factors to consider when choosing KPIs. First, consider what you want to measure and why it's important. Second, think about who will use the KPIs and how they will be used. Finally, make sure the KPIs you choose are achievable and relevant.
7. Set key performance indicator targets
There are a few things to consider when setting targets for your KPIs. You'll want to ensure that the targets are achievable and challenging enough to drive improvements. You'll also want to consider your available data and how accurate it is.
What to consider when setting targets:
When setting targets for your KPIs, you'll want to make sure that they are achievable but also challenging enough to drive improvements. You'll also want to consider your available data and how accurate it is.
8. Choose cohesive groups of KPIs
How to choose KPIs:
There are a few factors to consider when choosing KPIs. First, you'll want to ensure that the KPI aligns with your organization's goals. Second, you'll want to select a relevant KPI for your team or department. Finally, you'll want to ensure that the KPI is measurable and actionable.
KPI examples:
Below are some examples of KPIs that could be used in various industries:
- Sales KPIs: Revenue, number of new customers, number of sales leads
- Marketing KPIs: Website traffic, social media engagement, lead conversion rate
- Customer service KPIs: Customer satisfaction score, first call resolution rate, average handle time
- Human resources KPIs: Employee turnover rate, time-to-fill (the amount of time it takes to fill an open position), new hire retention rate
9. Gather internal feedback
Gathering feedback from employees is essential for several reasons. It can help managers identify areas where employees are struggling, identify training or development needs, and improve communication and collaboration within the team.
Feedback can also be a valuable tool for identifying potential issues before they become problems. For example, an employee who is consistently late to work may indicate a more significant issue, such as childcare needs or transportation problems. Addressing these issues earlier can prevent them from becoming more significant problems down the road.
How to do it:
There are a few different ways to gather feedback from employees. One way is to ask them for their thoughts and opinions on various topics. This can be done in one-on-one meetings, team meetings, surveys, or questionnaires.
Another way to gather feedback is to observe employees in their work environment. This can give you insight into how they interact with others, how they handle stress, and what kinds of tasks they find challenging. This type of feedback can be beneficial if you suspect some underlying issues need to be addressed.
Tools:
There are several different tools you can use to gather feedback from employees. One option is to use a survey tool such as SurveyMonkey or Google Forms. This can be a quick and easy way to gather input from large groups of employees.
Another option is to use a more sophisticated performance management system such as 15five or Small Improvements. These tools can help you track employee progress, set goals, and give feedback regularly.
10. Reassess your tracking choices periodically
Your business is dynamic, and your KPIs should be too. As your business grows and changes, so will the goals you're trying to achieve and the metrics you need to track. That's why it's essential to reassess your KPIs regularly.
What to consider when reassessing:
When reassessing your KPIs, there are a few things you should keep in mind:
-Are my current KPIs still relevant?
-Do my current KPIs align with my new goals?
-Do I have all the data I need to track my KPIs accurately?
-Are there any new KPIs I should be tracking?
Final thoughts
There are a few key things to keep in mind when using KPIs:
1. Set realistic goals. It's essential to set goals that are achievable and measurable. Otherwise, you won't be able to track your progress accurately.
2. Choose the correct KPIs for your business. Not all KPIs will be relevant to every business. Make sure you choose appropriate metrics for your industry and business model.
3. Monitor your KPIs regularly. Don't set and forget your KPIs – check in on them regularly to see how you're tracking against your goals."
Conclusion
There's no doubt that KPIs are essential for any business. If you're looking to track your business performance, you must invest in good KPI software. These 17 tools are some of the best on the market and will help you make informed decisions about your business. So what are you waiting for? Go and sign up for the best KPI software now!