In this article, we will discuss the 17 best stock chart software programs that are currently available. We will also provide a comparison table and review each program.
After reading this article, hopefully, you will be able to choose the right investment tracking tool for your trading needs!
What are the best stock chart software?
1. TradingView
TradingView is a real-time streaming service that provides research and information on stocks and cryptocurrency exchanges. It offers stock screeners, technical analysis tools, real-time tracking of Bitcoin, Ethereum, and Litecoin prices, as well as other useful features for investors and traders.
Nick's Take
From my perspective, I think that TradingView is a great tool for traders who want to track stock prices and forex rates in real time.
Features:
- Includes hundreds of pre-built studies, 50+ intelligent drawing tools, and tools for market analysis that cover the most common trading concepts.
- Pine Script(tm), which TradingView created, allows you to create and share your indicators.
- Simulate real trading directly on your chart. Real-time simulation of real trading using historical data.
- A large volume of fundamental data is available for all major stock exchanges.
- Broadcast trading activity live or post analysis as a video.
- Talk to traders around the globe and you will never trade alone again.
- Get a detailed look at the crypto and stocks around the world. Comparing companies based on fundamental data and their performance.
- You can filter assets according to the criteria you set. You should look for the best-performing cryptocurrencies or the lowest-cost companies.

Pricing:
Monthly:
Pro – $14.95/month
ProPlus – $29.95/month
Premium – $59.95/month
Annually:
Pro – $155.40/year
ProPlus – $299.40/year
Premium – $599.40/year
2. Stock Rover
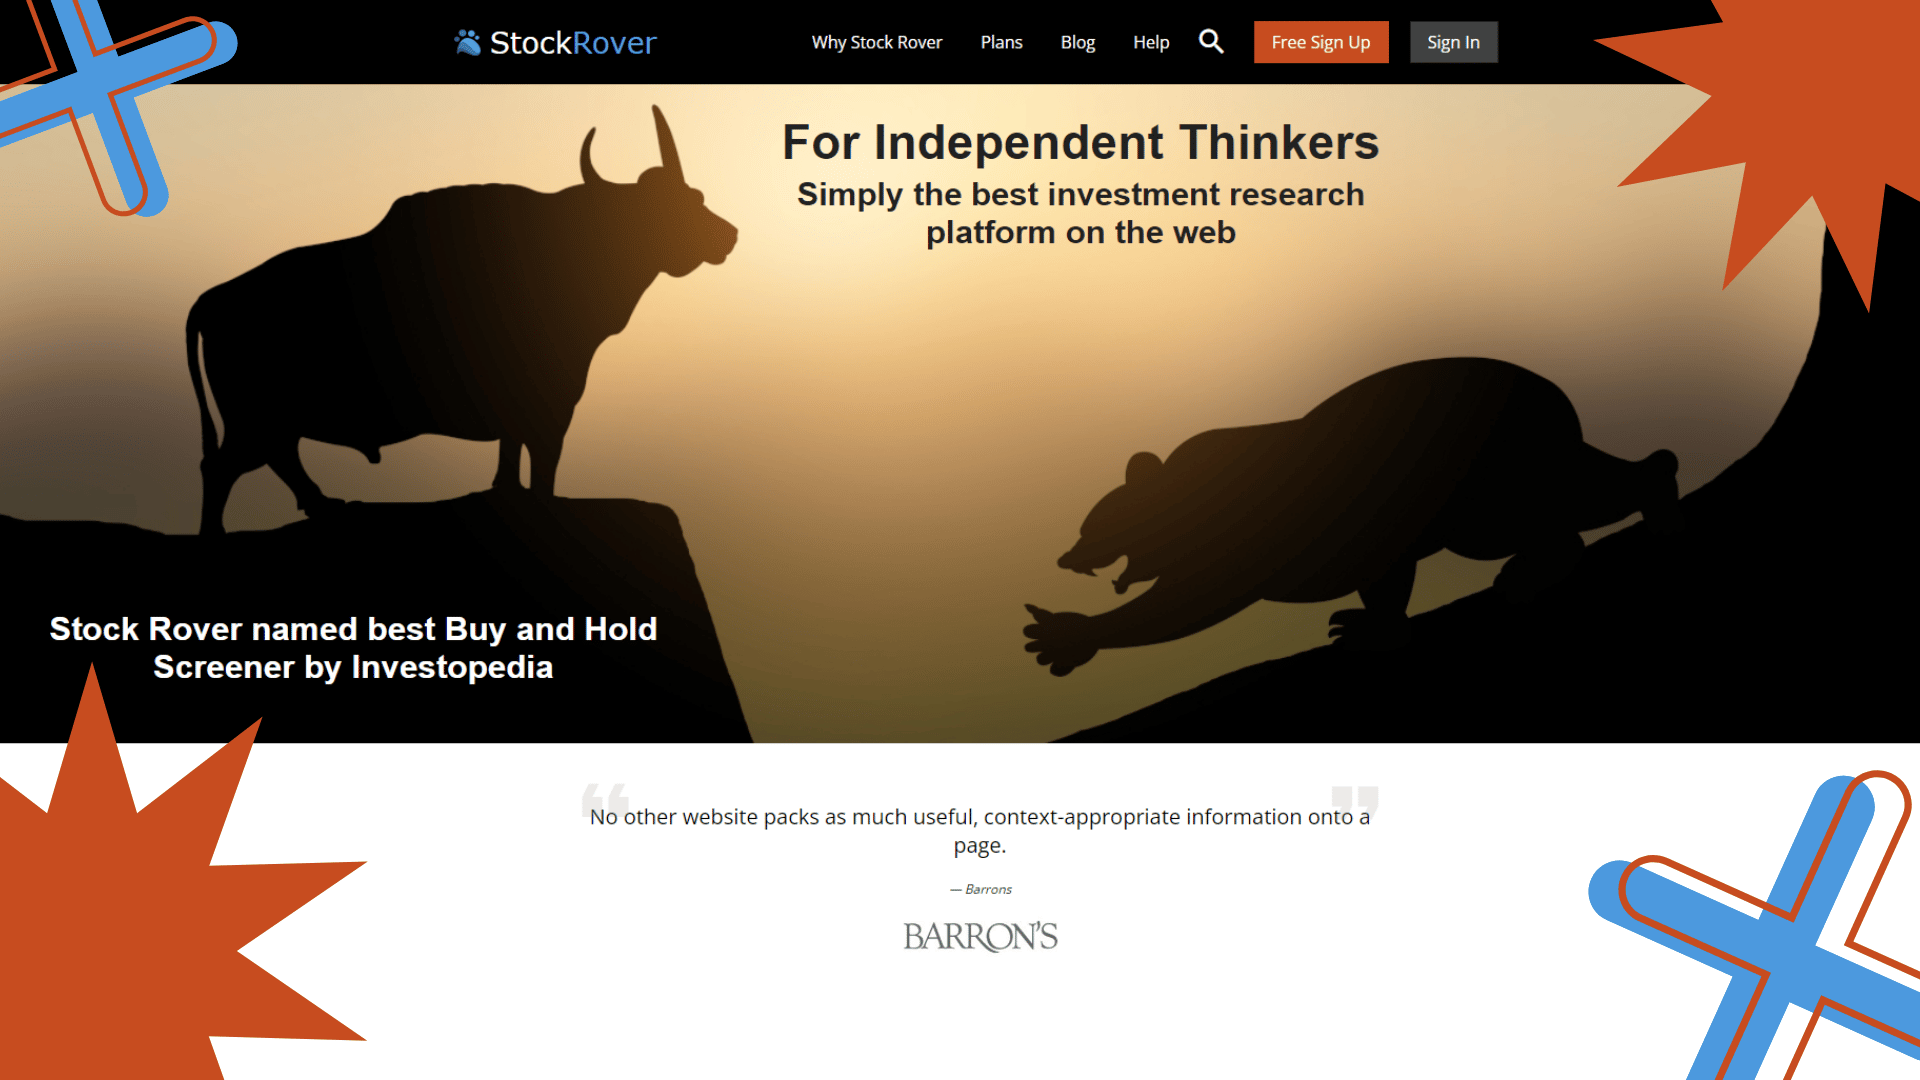
Stock Rover is a tool that helps investors research and analyze stocks, ETFs, and portfolios. It’s web-based so it can be used from anywhere, and it has years of data for North American companies and over 10 years of data for financial metrics. Stock Rover makes it easy to see how stocks are performing and to compare different investments side-by-side.
Nick's Take
I believe that Stock Rover is one of the best stock-tracking apps and can be used to track all your investments.
Features:
- Screening capabilities are unparalleled at all price points. It has a powerful screener, which can rank and find stocks.
- Stock Rover is the only site that compares investment options.
- Stock Rover calculates fair values and margins of safety warn you about trends that are worth your attention, and scores companies for quality and growth, value, and sentiment.
- One click and you can dive into any stock. The report contains all the information you need about the stock. It is easy to conduct thorough research on a company by simply looking at the information.
- You can view performance metrics that are up-to-the minute. For automatic portfolio updates, link to your brokerage.
- Our charts allow you to compare portfolios, screeners, and other benchmarks beyond what is the industry standard
Pricing:
Essentials
$7.99/month
$79.99/year
$139.99/2 yr
Premium
$17.99/month
$179.99/year
$319.99/2 yr
Premium Plus
$27.99/month
$279.99/year
$479.99/2 yr
3. eSignal
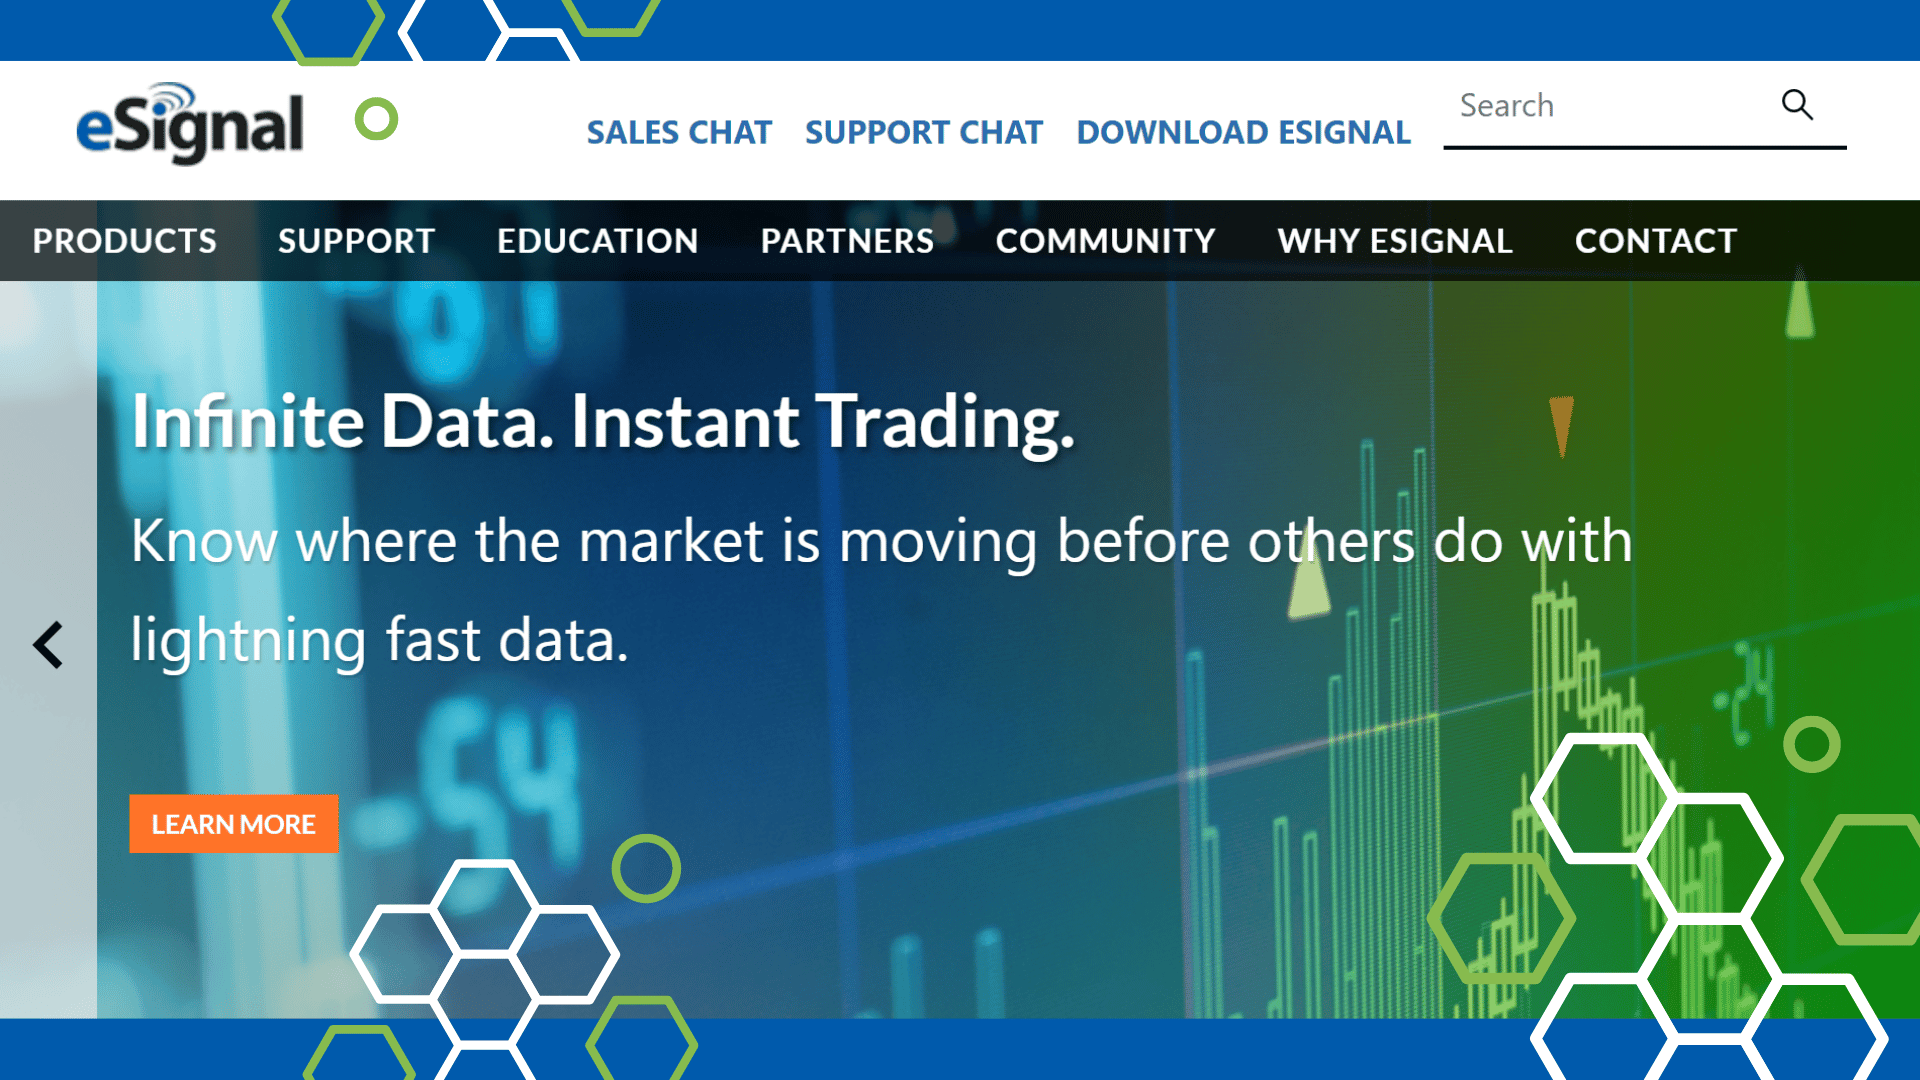
eSignal is a high-end stock charting app that supports hundreds of global markets. This platform offers ultra-reliable real-time data for traders with deep pockets. Plus, it lets you subscribe to nearly all global stock exchanges instead of being limited to North American exchanges.
Nick's Take
I think that eSignal is one of the most comprehensive stock analysis software available on the market today. With its impressive range of features and robust platform, it’s no wonder this application has been so popular among experienced traders.
Features:
- Features of the eSignal platform include customizable charts, technical indicators, and scanning for new trading opportunities.
- The charts can be scanned quickly and easily using preset criteria.
- The eSignal platform offers real-time streaming futures prices.
- The platform can be configured to send alerts based on a variety of parameters.
- The data is extremely accurate and offers a variety of market indices and Forex charts.
- ESignal allows traders to stay up to date with the latest news and analysis in the market.
- Some of the features of eSignal include a symbol format that is easy to understand, fast market indicators, and the ability to view spreads and contract highs and lows.
- The eSignal platform is flexible enough to integrate with your futures broker, allowing you to trade from the charts, trade manager, and tick data.
- The eSignal platform has an extensive archive of articles focused on futures trading markets
Pricing:
Classic
$58/month
$576/year
Signature
$192/month
$1739/year
Elite
$391/month
$3772/year
4. Worden TC2000
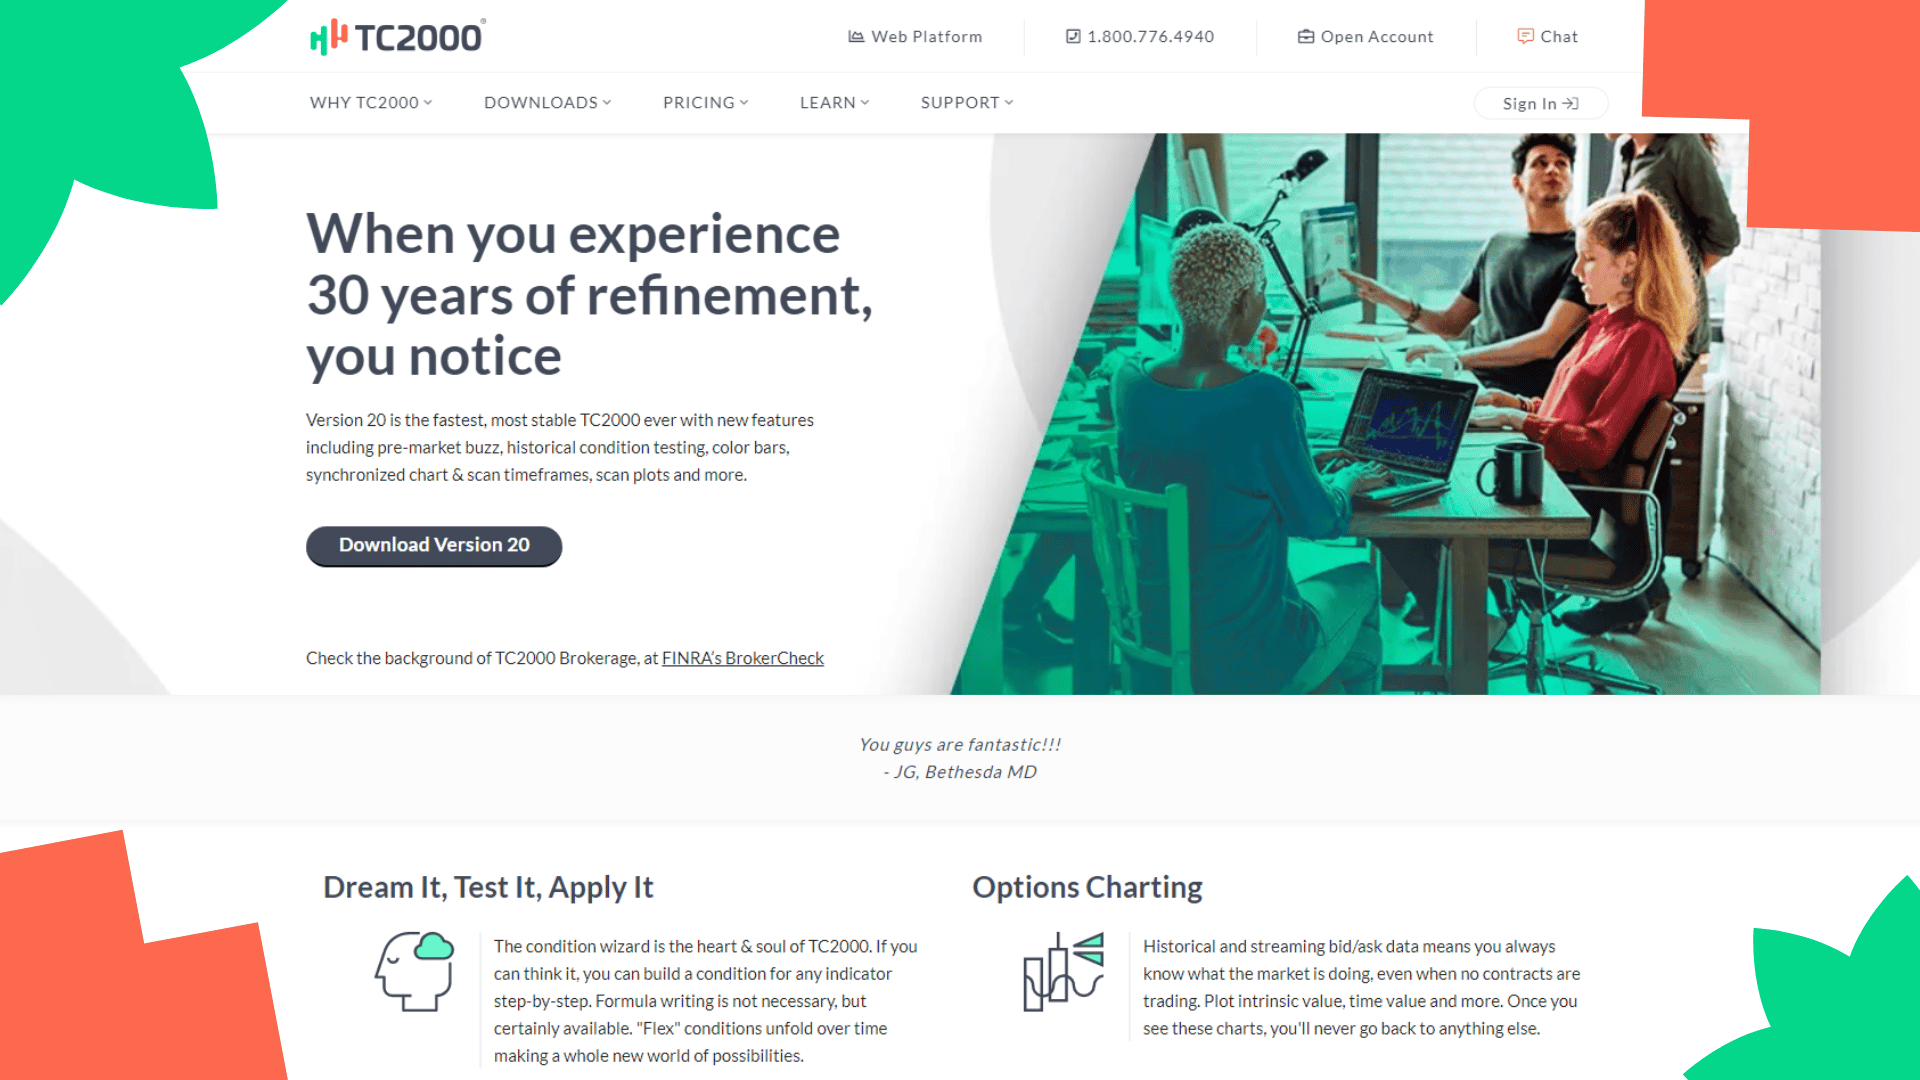
The TC2000 platform is a technical analysis software package offered by Worden Brothers, Inc. It offers many features for users, including low-latency servers and synched charts. The software also has a fully functional trading simulator which can be used by beginners to learn how to trade without putting any real money at risk.
Nick's Take
It seems to me that the TC2000 platform is a great choice for investors who are looking for an analytical tool with a focus on charting.
Features:
- The Worden TC2000 allows traders to create unlimited paper accounts to test strategies.
- The Worden TC2000 has a drag-and-drop symbol editor which helps keep plans organized.
- Worden TC2000 allows you to write notes and save charts for quick reference.
- The P&L zones on the right side show profit, loss, and breakeven levels for the stock at expiration.
- You can use Worden TC2000 to find options and strategies that will make money.
- TC2000 lets you trade multi-leg options with ease, displaying the impact of each move on risk/reward.
- The charting features help you identify trends and patterns, and draw trendlines to help you make better investment decisions.
- TC2000 allows you to place multiple orders to exit a position as needed.
- The Worden TC2000 offers features such as swing size measurement, drag limit and stop orders, chart customization and library saving, and a large range of indicators to choose from.
Pricing:
Silver – $9.99/month
Gold – $29.99/month
Platinum – $89.98/month
5. TrendSpider

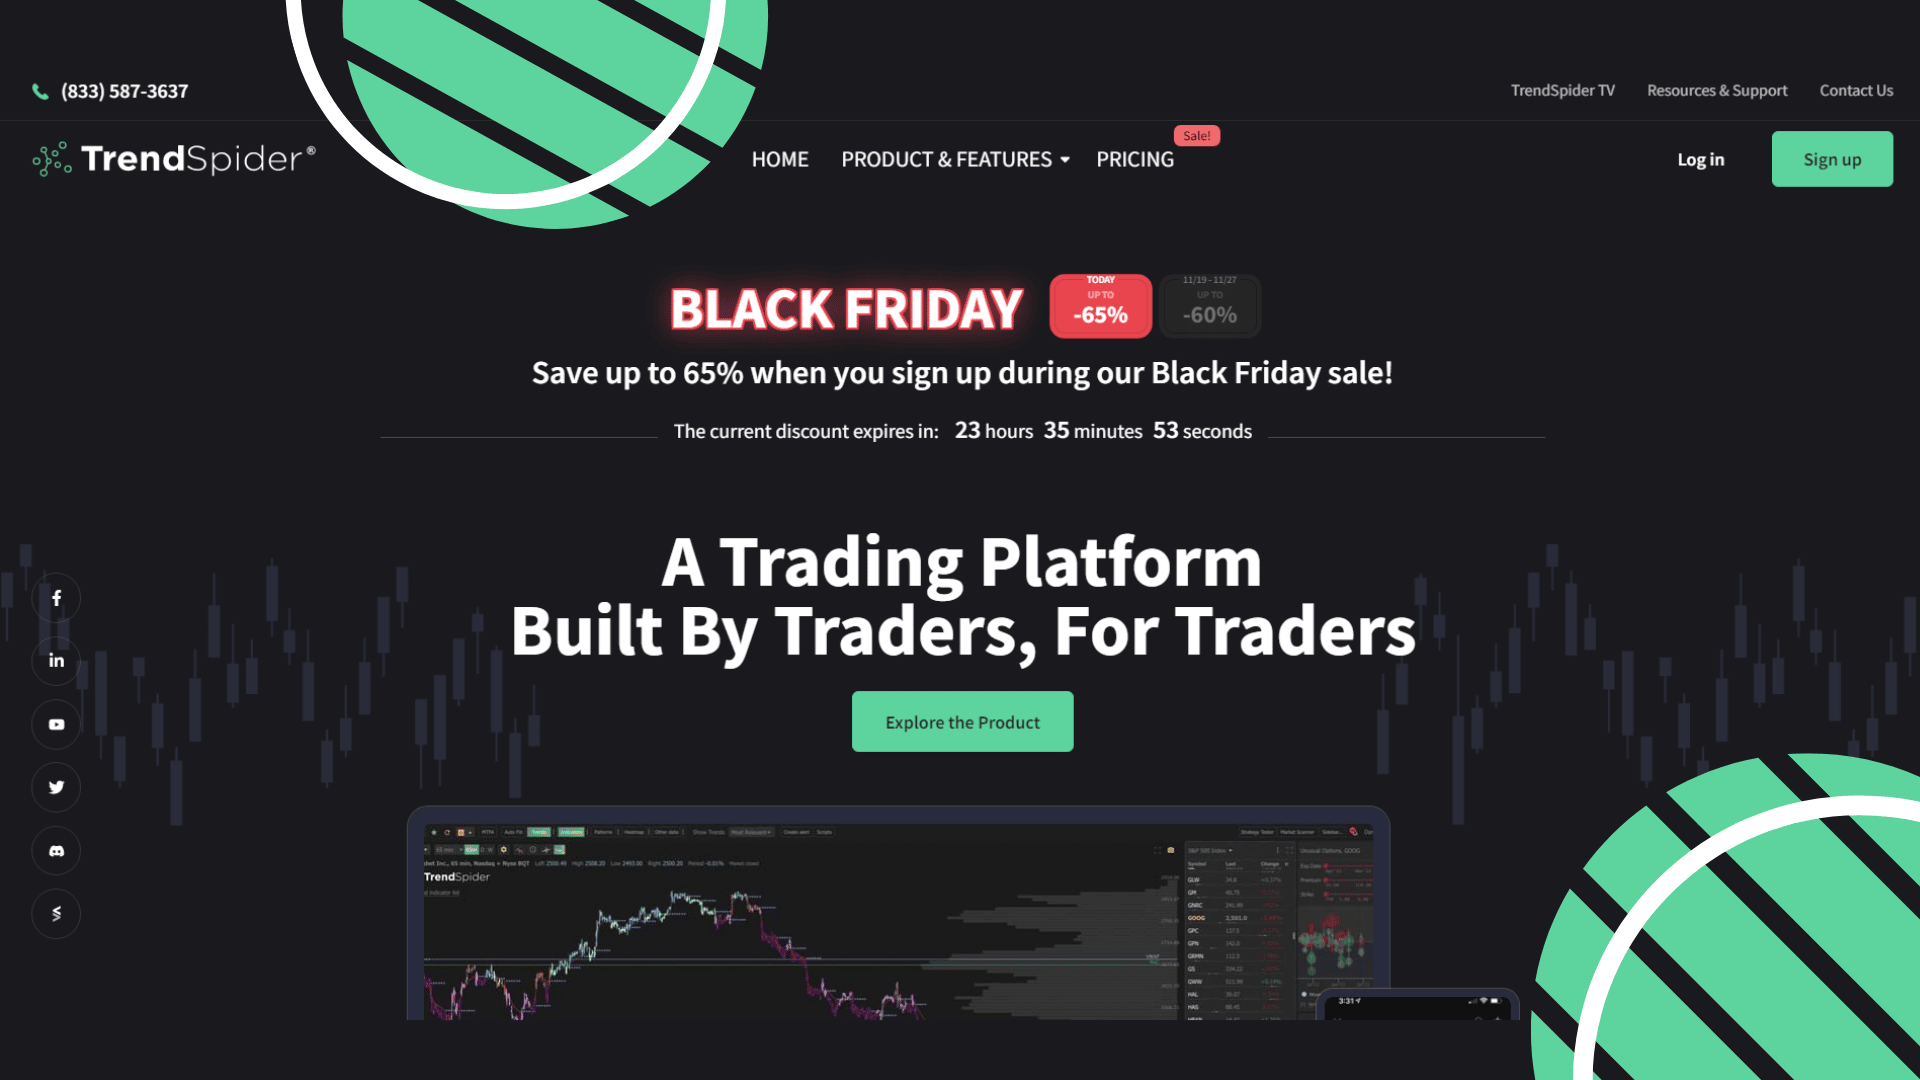
TrendSpider is a technical analysis software that offers extensive charting capabilities and real-time data. The app is available on browsers and mobile devices and has a free trial with full access. TrendSpider’s main features include automated trendlines, Fibonacci Retracements, price alerts, and custom indicators.
Nick's Take
From my perspective, TrendSpider is a great selection of stock charting tools that are perfect for technical traders.
Feature:
- The TrendSpider scanner can be used to scan the markets for stocks, commodities, and bonds.
- Provides alerts for a variety of different products and services.
- Scripts help traders understand what the charts are telling them and assess risks.
- Has automatic trendline detection and Fibonacci retracements.
- Can detect and highlight over 40 different candlesticks.
- Allows you to set complex, multi-conditional alerts.
- Has a light charting load, making it easy to understand and use.
- Allows users to create their trendlines and price alerts.
- Offers multi-timeframe analysis, which is helpful for understanding longer-term trends.
- Users can overlay their charts with several popular indicators.
Pricing:
Monthly:
Advanced – $70.95/month
Elite – $51.35/month
Premium – $27.30/month
Yearly:
Advanced – $33.95/year
Elite – $29.25/year
Premium – $16.50/year
6. Finviz

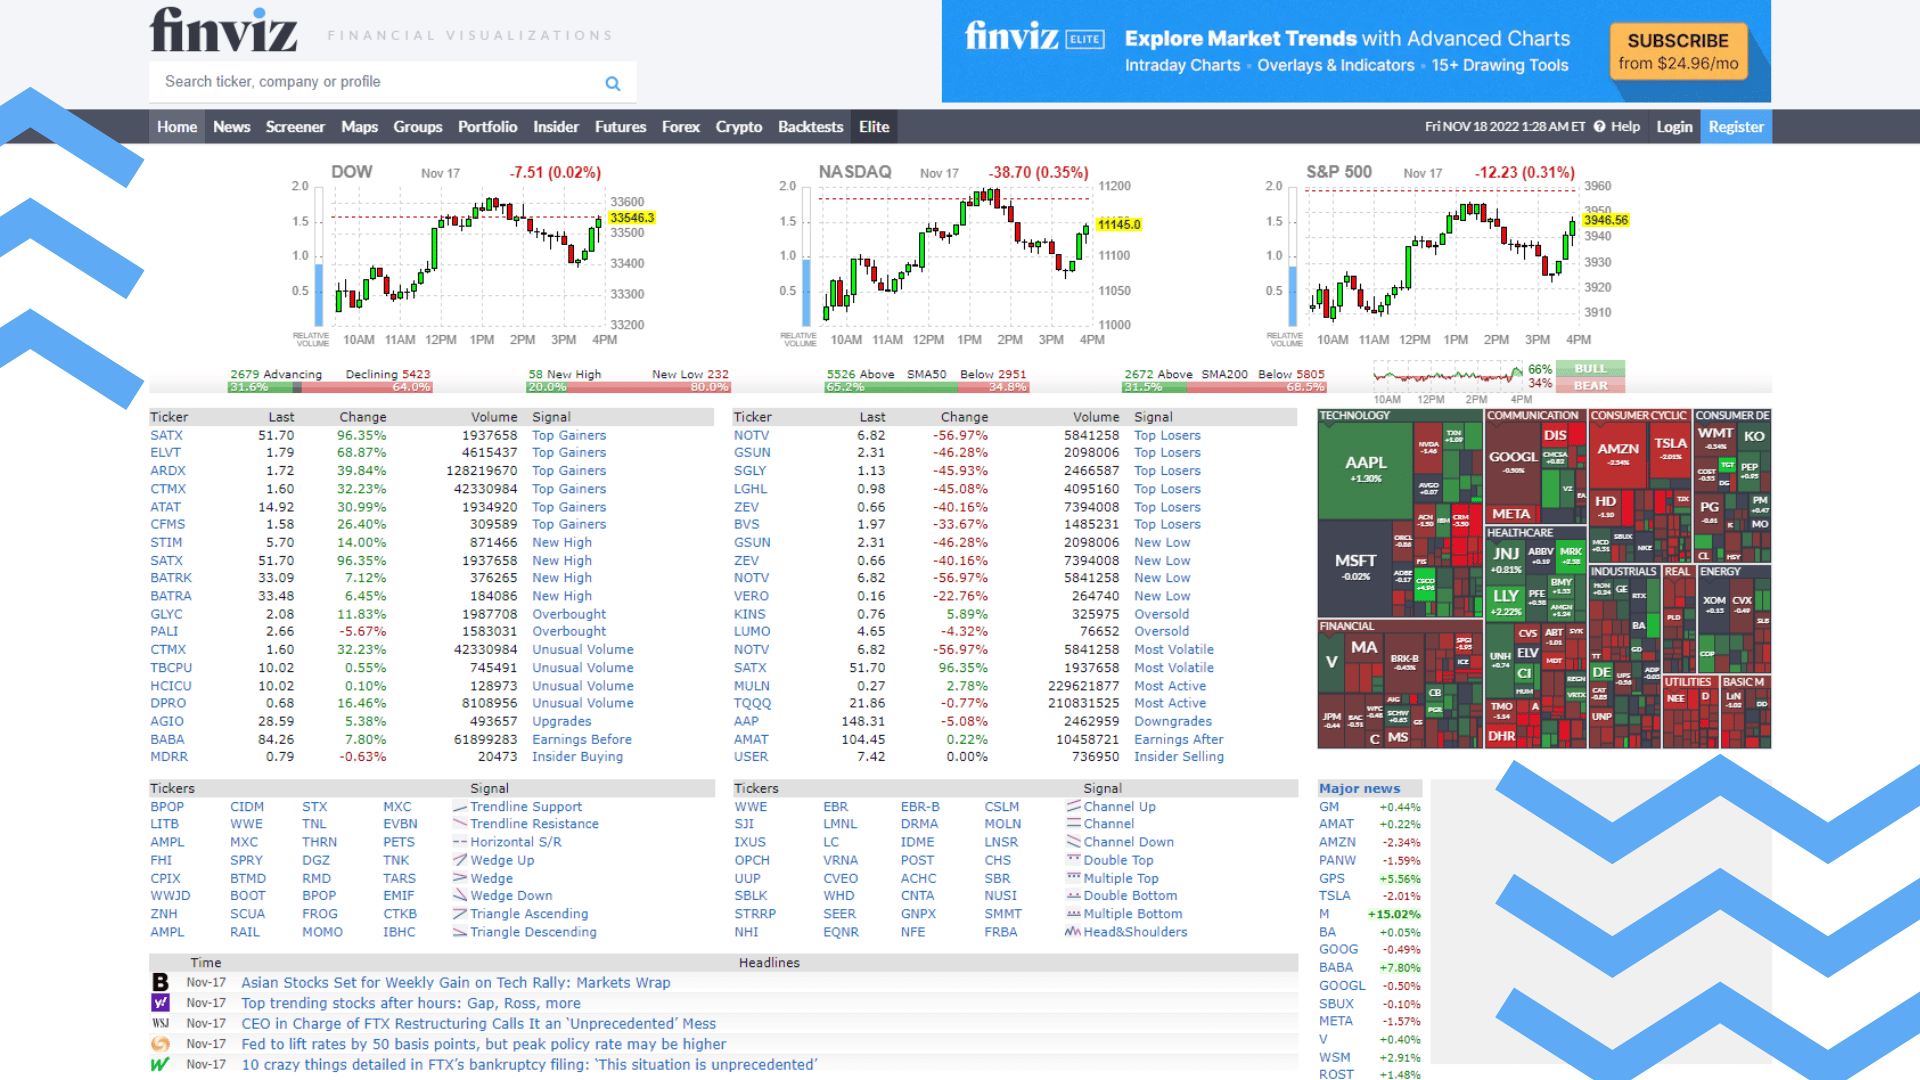
Finviz is a complete toolbox for traders and investors, with a particular focus on the US markets. Finviz’s stock market portal includes stock screeners and news feeds as well as portfolio management, stock charts and more. Finviz’s mission statement is to offer financial analysis, visualization, and research that is top-notch to its users.
Nick's Take
It seems to me that Finviz is a great resource for stock traders and has many features for both novice and experienced traders.
Features:
- You can track up to 50 portfolios and 50 tickets per portfolio with the free account.
- You can also track stock screener presets.
- Finviz offers real-time intraday charts with Finviz Elite account holders.
- The stock screener allows users to search for stocks by various criteria such as P/E, Dividends, and Performance figures.
- The newsfeed lists the latest news and articles according to news and blogs either chronologically or – if selected – by origin.
- Allows visitors to track and filter stocks based on several criteria.
- The data export feature is helpful if you want to crunch the data manually.
- It can be used to analyze sectors, industries, countries, and capitalization levels.
Pricing:
Monthly – $39.50/month
Yearly – $299.50/year
7. Seeking Alpha

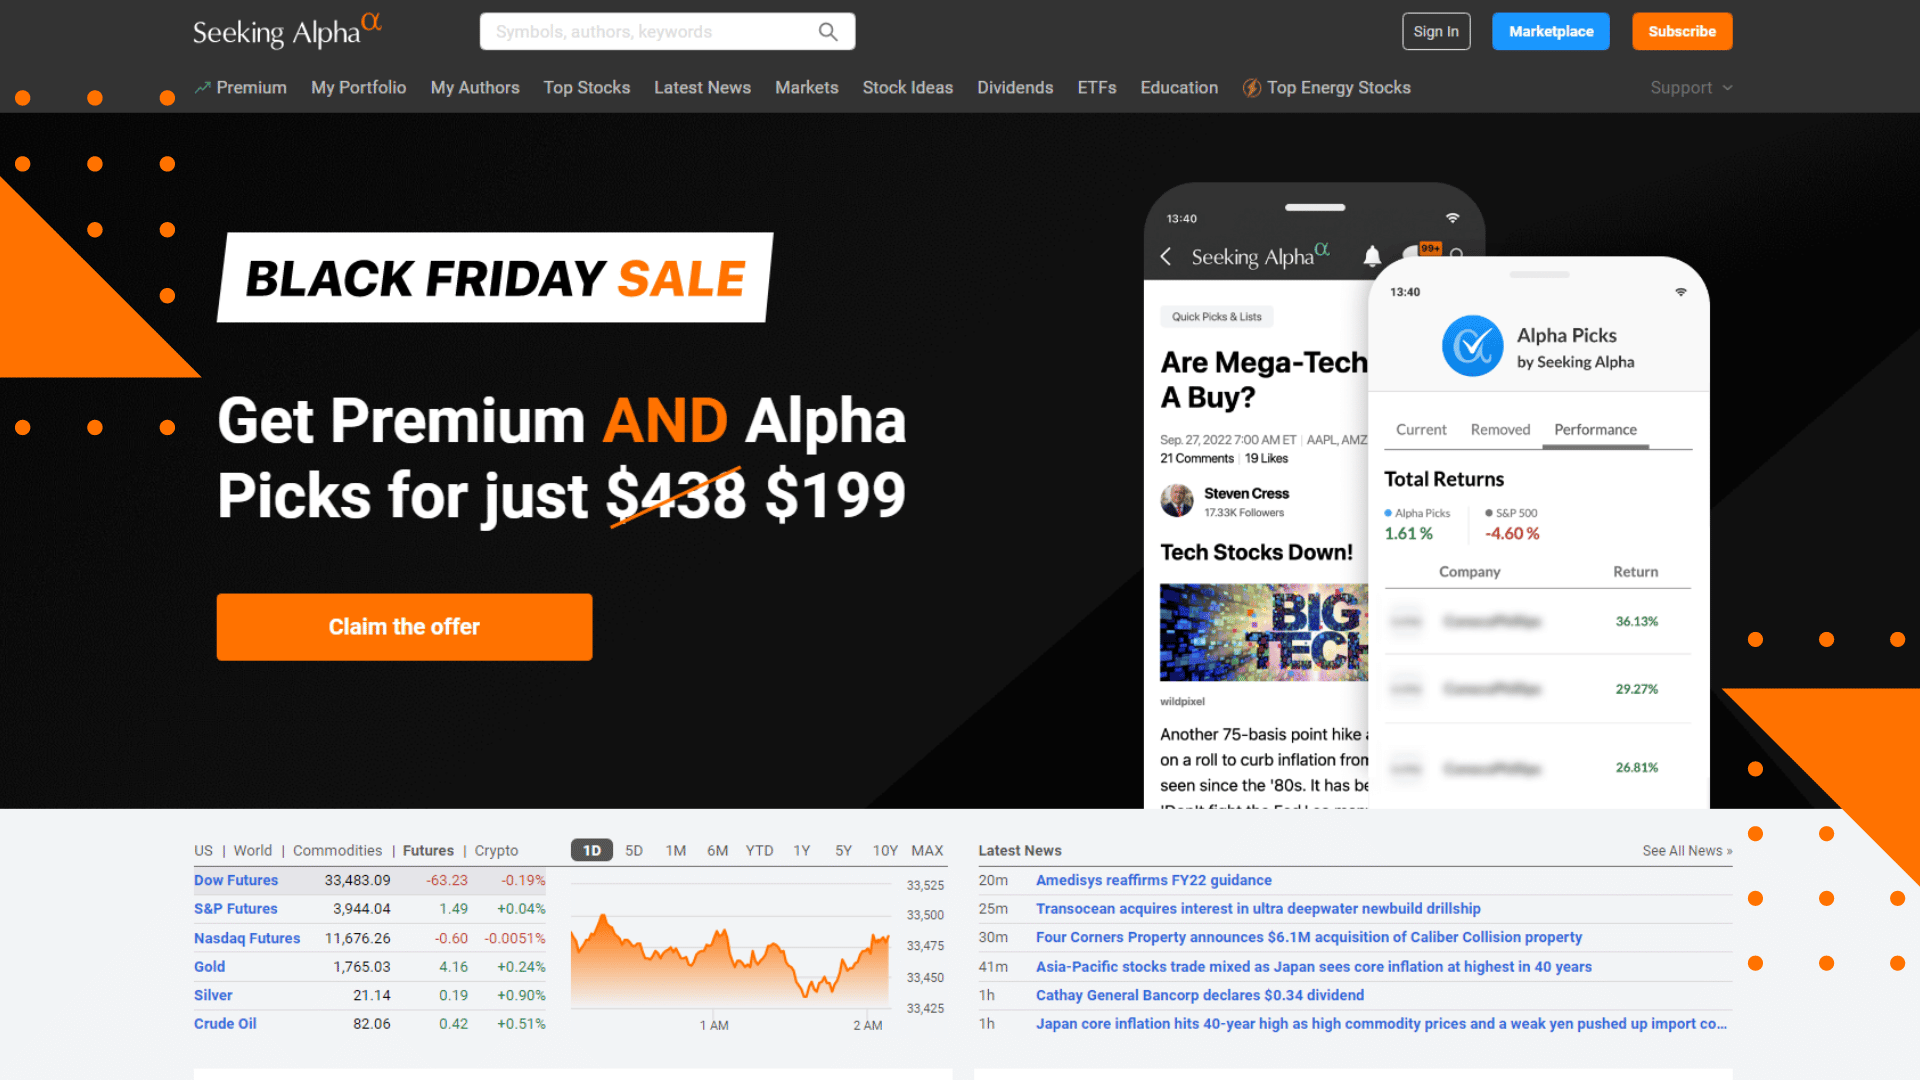
Seeking Alpha is one of the best portfolio analysis tools available. It offers stock market news, fundamental data, and analysis, as well as advanced features like pre-configured screeners and quant ratings. The platform is easy to use and helps investors make better-informed decisions about their portfolios.
Nick's Take
I think that Seeking Alpha is an excellent source for free stock market news and high-quality analysis from experts.
Features:
- The Seeking Alpha Quant rating system uses clear financial metrics to rank stocks from strong buy to strong sell, making it one of the most effective portfolio analysis tools available.
- You can connect all your financial accounts in one place with Seeking Alpha’s portfolio management features, allowing you to track your investments in one place.
- The Seeking Alpha Quant app allows users to analyze stocks and track their performance over time.
- The stock research feature allows you to explore company information in a variety of ways.
- The Seeking Alpha rating feature provides a history of ratings for a company.
- The stock rating screener allows you to quickly filter the full stock universe based on ratings.
- The premium articles include performance statistics and rating information for the featured stock.
- The “Top Authors to Follow” feature helps you find the best authors for various investment strategies.
Pricing:
Basic – Free
Premium – $119/year
Pro – $499/year
8. Yahoo! Finance

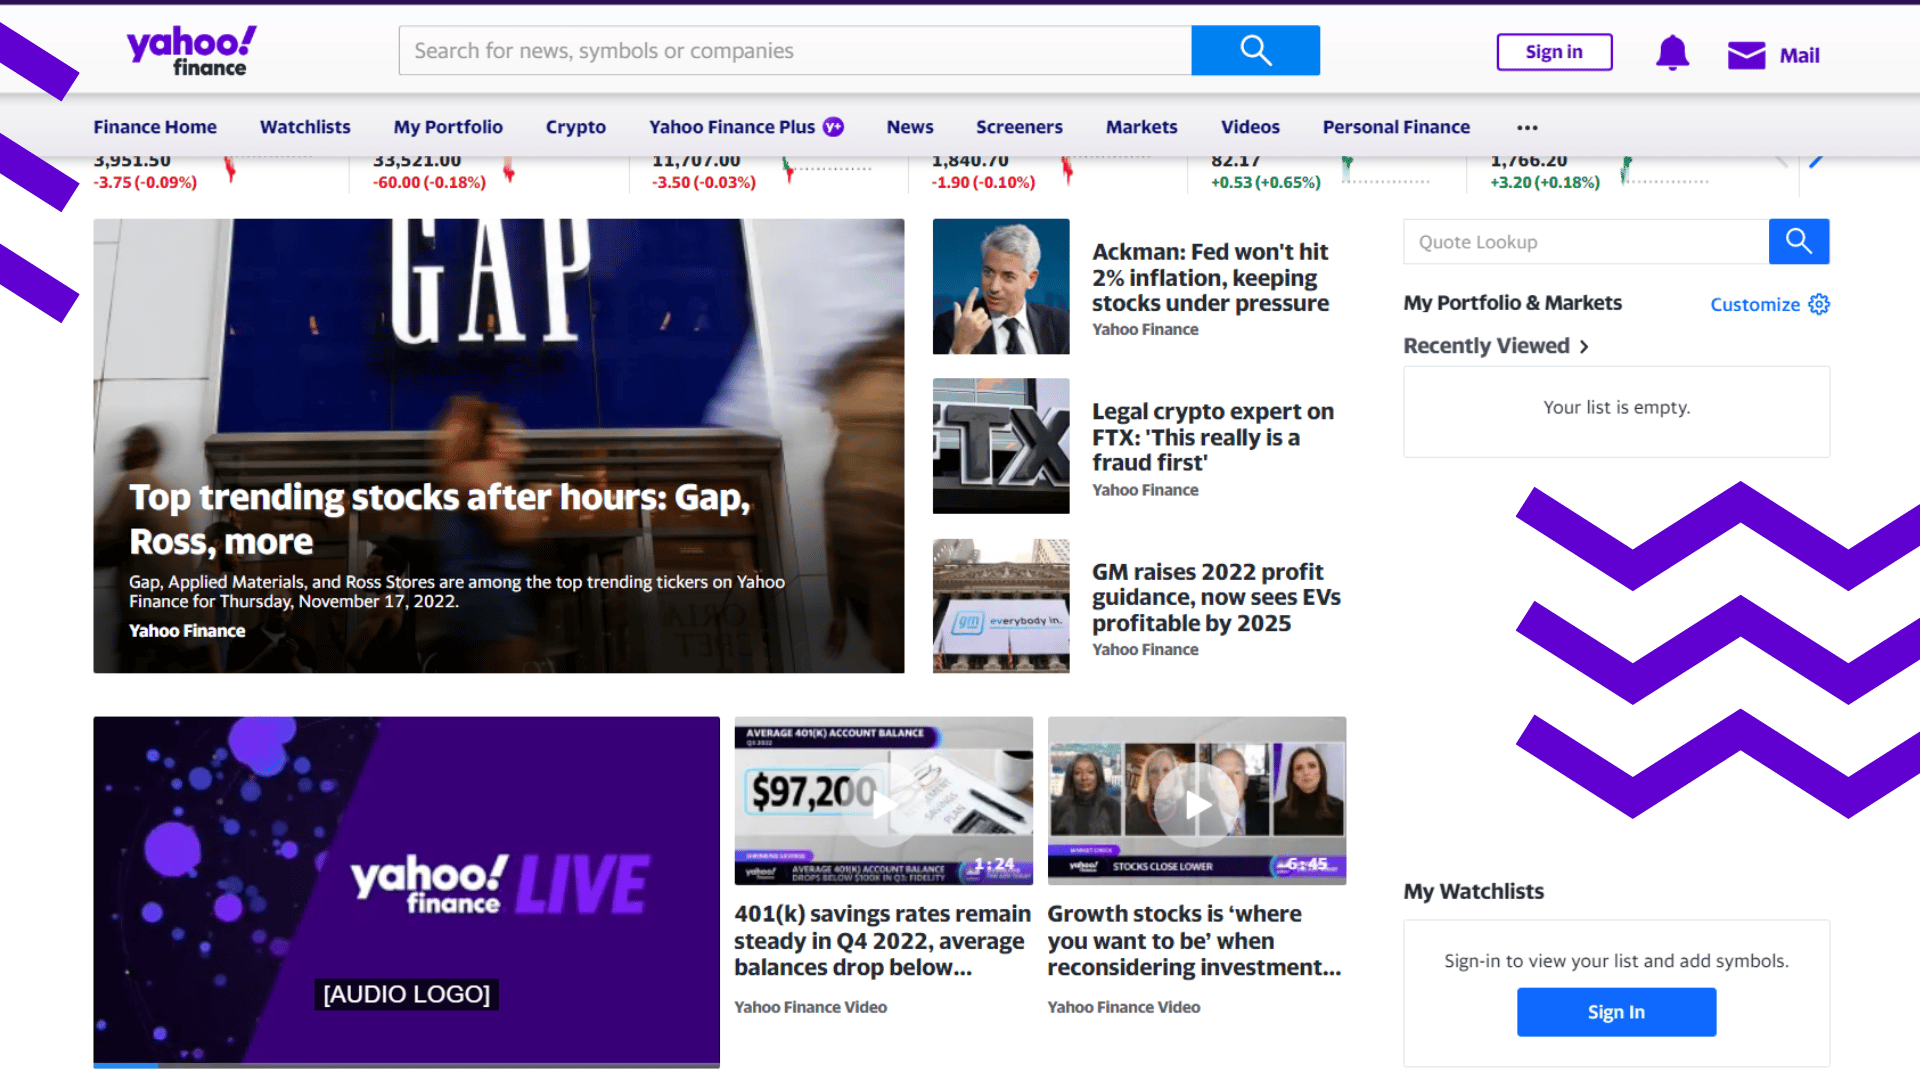
Yahoo! Finance is a popular stock charting and trading tool that allows users to view stock prices, charts, and other important information. The Premium subscription includes access to exclusive insights and data, advanced charts and tools, intuitive data visualization, advanced portfolio analytics, enhanced charting for technical and event analysis, live chat on desktop, and an Ad lite experience.
Nick's Take
It seems to me that Yahoo! Finance is good for traders as it lets traders create an unlimited list of stocks to follow and offers daily trading ideas.
Features:
- The Yahoo! Finance website provides a range of tools to help you measure your investment performance and track your portfolio’s progress.
- The website offers access to independent research on hundreds of stocks, market and economic commentary, portfolio ideas, and more.
- You can compare the price of a stock to its target price to find good investment opportunities.
- Yahoo! Finance’s charting and analysis tools help identify patterns and trends.
- Yahoo! Finance offers alternative data sets which can be used to make informed investment decisions.
- Company profiles offer insights into key alternative data metrics such as hiring, innovation, and supply chain dependencies.
- Research reports and investment ideas provide a wealth of information on stocks that are trending or relevant to the companies you follow.
- Advanced portfolio analytics allow users to measure portfolio performance and allocation, manage risk and volatility, and increase returns across multiple linked brokerages.
Pricing:
Essential – $29.16/month, billed annually
Lite – $20.83/month, billed annually
9. Trade Ideas
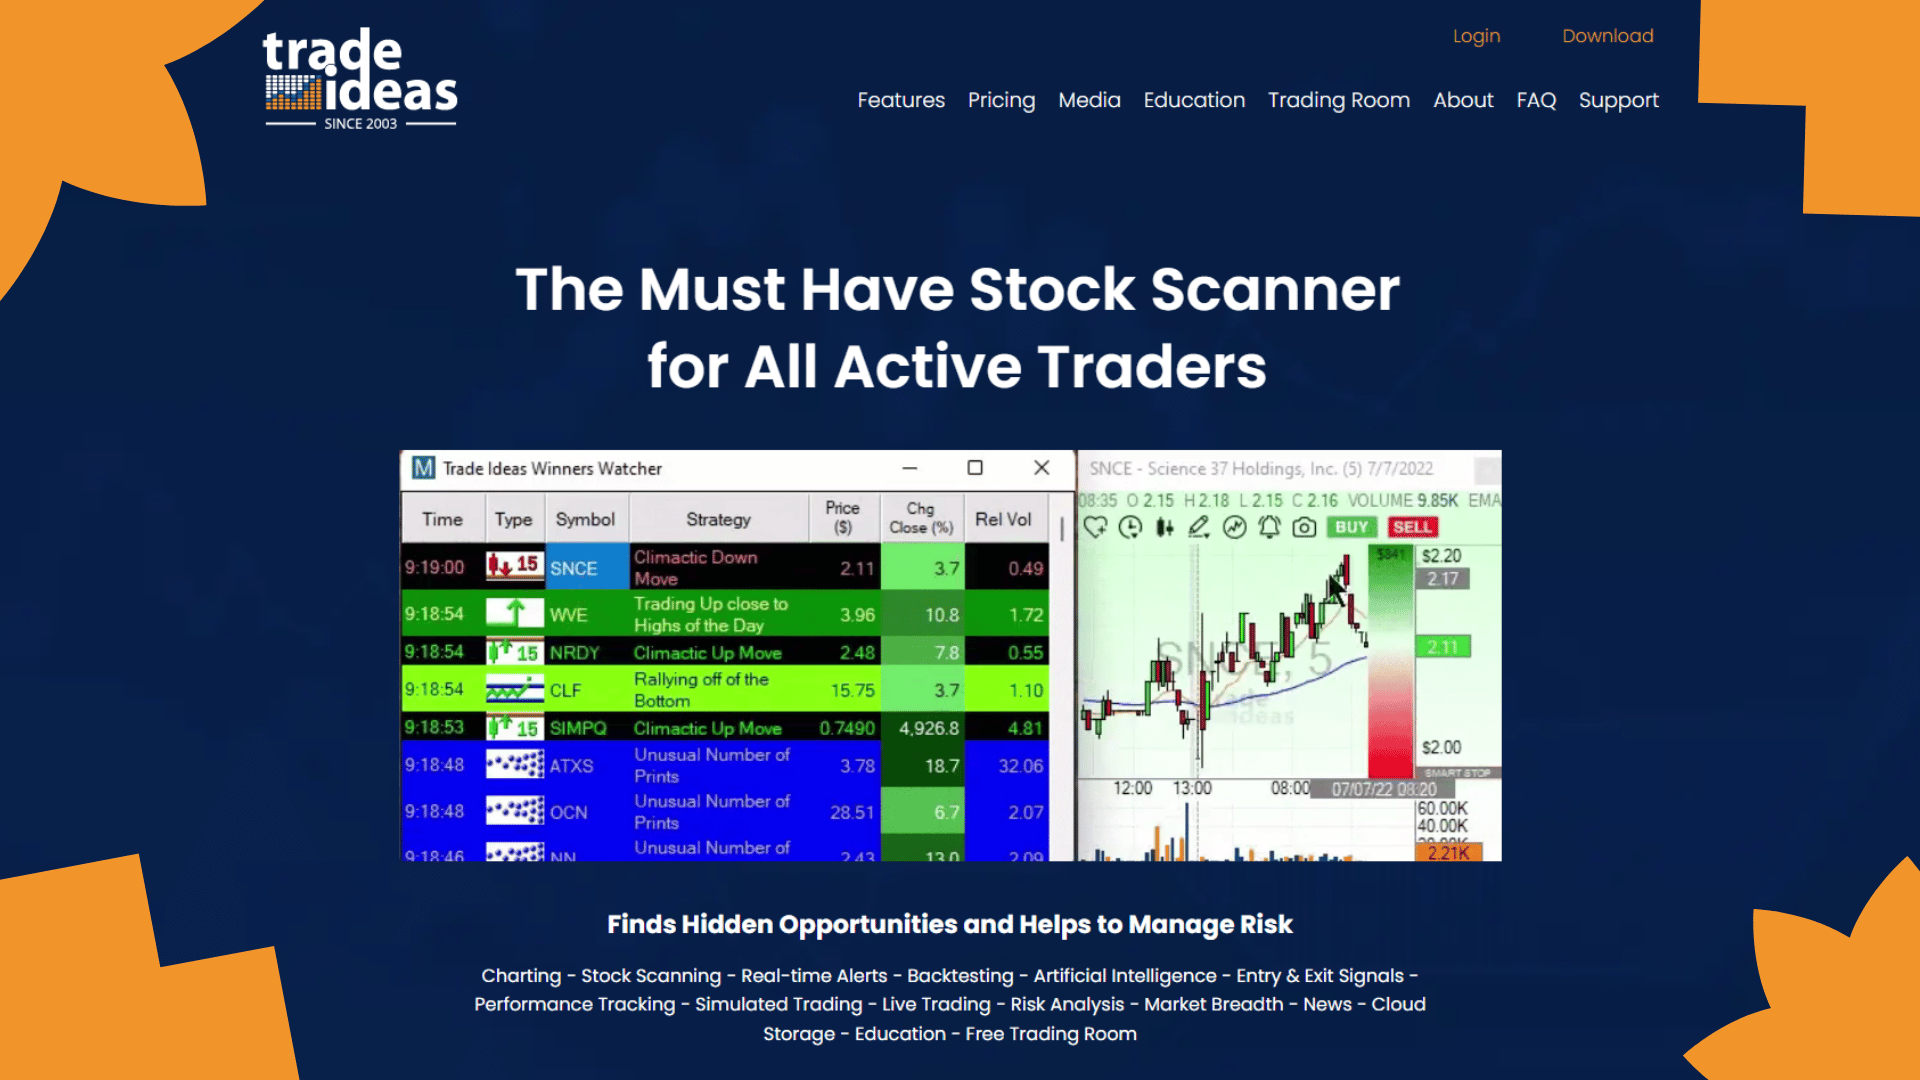
Trade Ideas is a company that provides trading tools and services to help traders make informed decisions. Trade Ideas is the most comprehensive stock trading software available, and especially beneficial for day traders. The company offers a wide range of features, including real-time quotes, charts, news, and analysis.
Nick's Take
I think that it is easy for subscribers to trade live with Trade Ideas as this platform links with most major trading platforms.
Features:
- HOLLY AI, an artificially intelligent trading assistant, helps identify profitable trades for subscribers’ strategies.
- Trade Ideas allows you to automate your strategies and have them executed directly through your Interactive Brokers account.
- Trade Ideas allows you to score how well scans, entry signals, and trading plans perform over recent history.
- The Chart Windows allow you to quickly confirm an alert without leaving the Trade Ideas Pro platform.
- The Trade Ideas full stock quote windows provide important data such as the stock’s range and trends over time.
- You can display events as they happen in real-time and add graphically rich columns to enhance your data.
- The Compare Count Windows allows users to compare two strategies visually.
- Stock-relevant news is available in the Single Stock Window tab.
Pricing:
Premium
$228/month
$167/month, billed annually for $1999
Standard
$118/month
$84/month, billed annually for $999
10. E*Trade
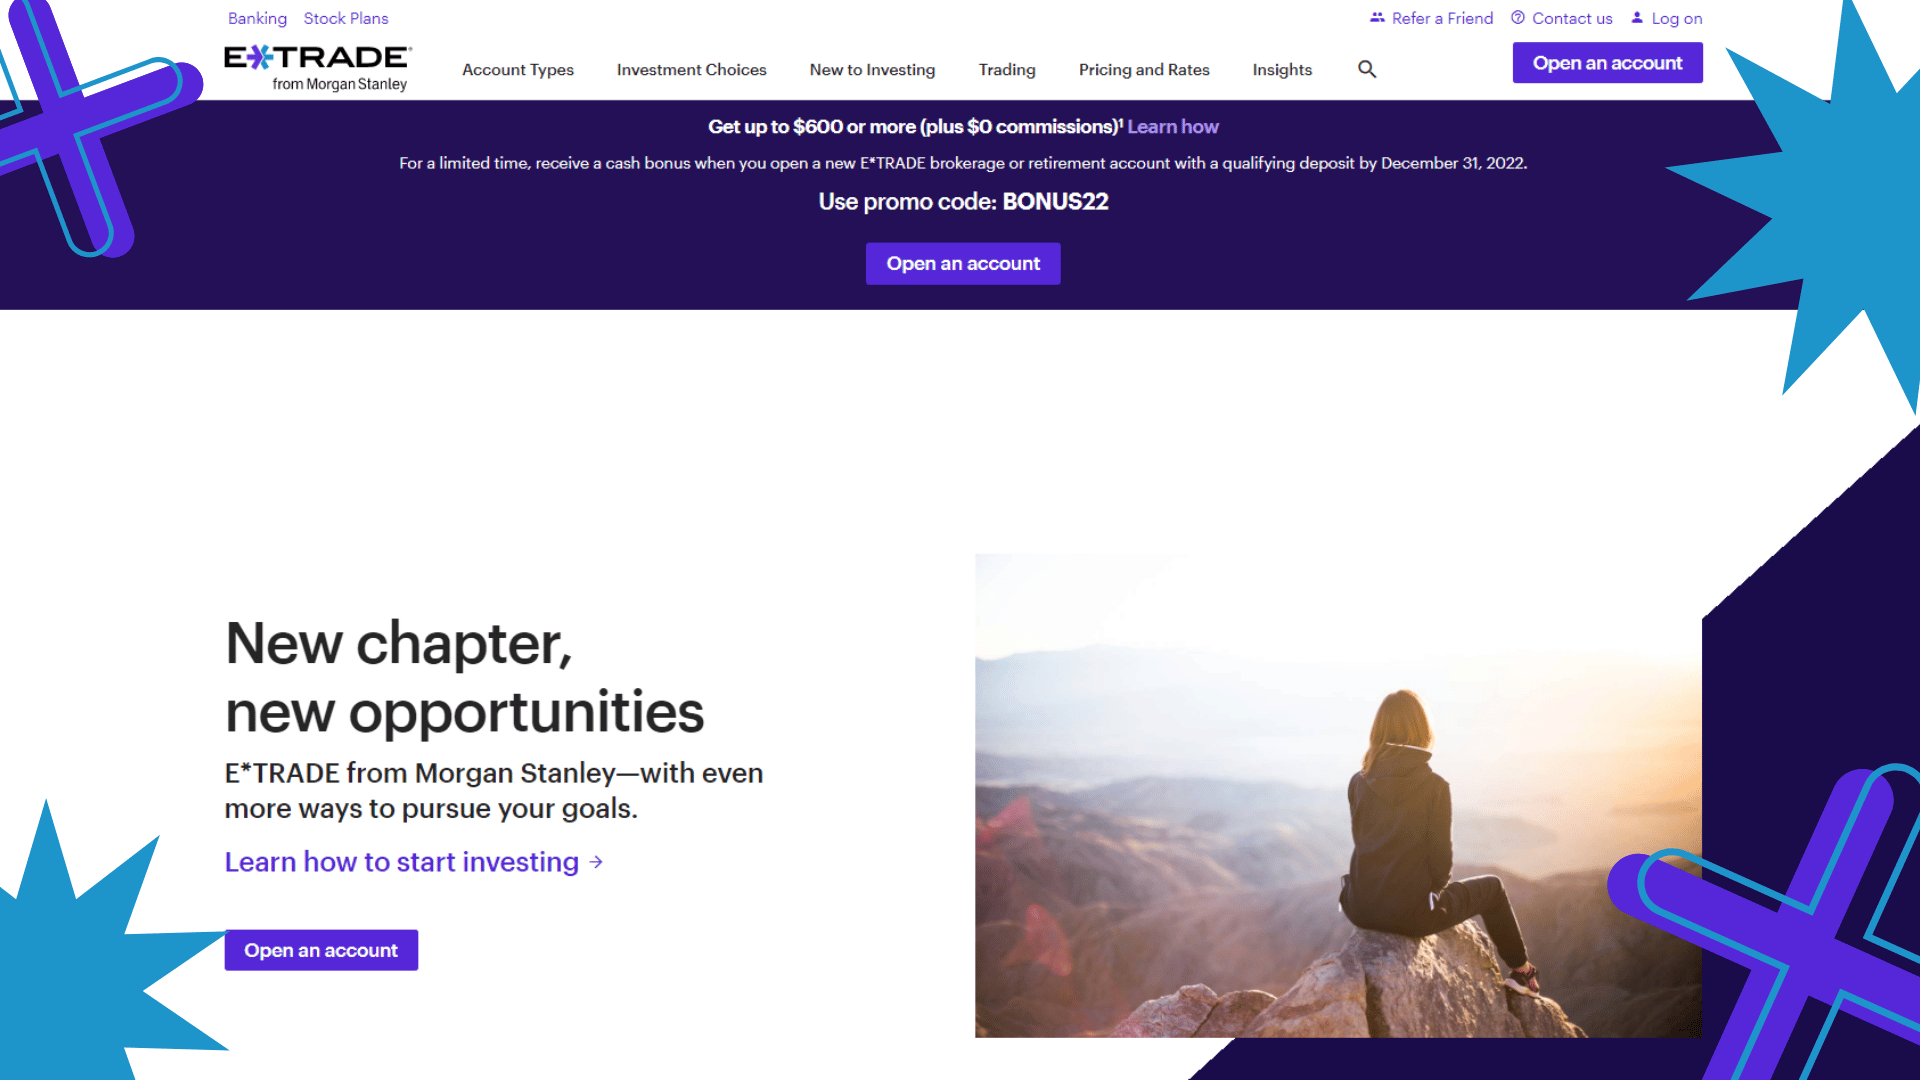
E*Trade is an online brokerage solution for investors and traders. It offers a wide range of features, including low commissions for online US-listed stocks, options, and ETFs, as well as future contract trading fees. E*Trade also provides active traders with access to the trading platform E*Trade Pro, which is an installable software for Windows.
Nick's Take
It seems to me that The E-trade platform is a top stock trading software used for managing metals, equities, indices, and other types of stocks.
Features
- The software can create performance reports and send signals as and when the status of stock changes.
- The message center highlights any offer or announcement along with top trades.
- The web-based platforms can be opened anywhere, making it accessible from any device or location.
- Options trading is possible through a range of order types, including conditional and durational orders.
- The platform offers helpful tutorials and resources to help traders understand the complex mechanics of options trading.
- E*TRADE offers a range of managed portfolio services, with different minimum balance requirements and fees.
- Users can get help from financial consultants when using Core Portfolios.
- The Power E*TRADE Advanced Trading app enables more complex trading than the basic app.
- The real-time quotes and streaming market news are ideal for those who want to stay on top of minute-by-minute changes.
Pricing:
Stocks, options, and ETFs – $0
Options contracts – $0.65, 50¢ with 30+ trades/quarter
Future contracts – $1.50
Bonds (online secondary trades) – $1.00/bond (minimum of $10, maximum of $250)
11. TradeStation Analytics
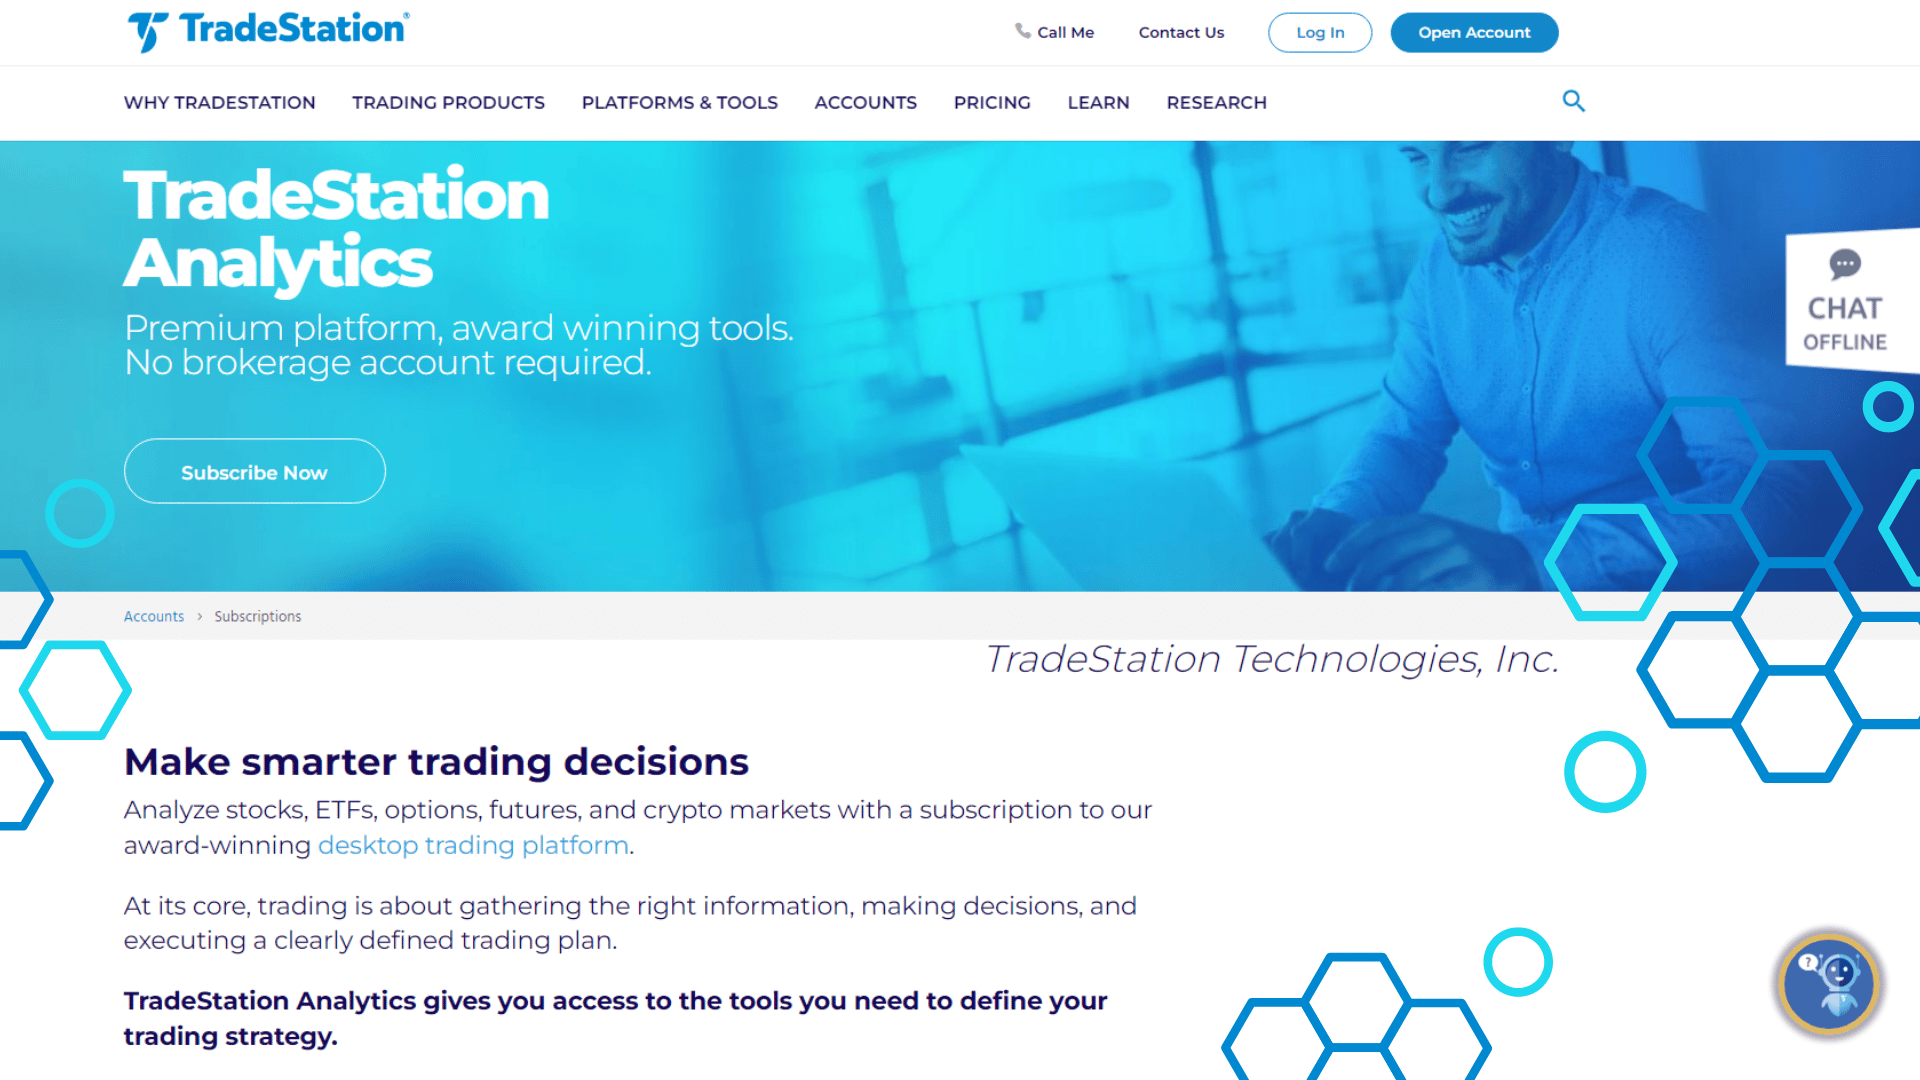
TradeStation is a technical analysis software platform that was created with the professional trader in mind. The software is designed to be used for backtesting trading strategies, as well as developing and testing new ones. TradeStation is compatible with all major Microsoft Windows versions and also offers a web-based platform.
Nick's Take
From my perspective, If you’re looking for a zero-commission U.S.-listed stock trading application, TradeStation is definitely worth considering. You also have the opportunity to use their web-based platform if you don’t want to install software on your computer.
Features
- TradeStation users can create trading systems based on technical events.
- A mobile app that is compatible with Android-based devices, iPhones, and iPads.
- This software offers comprehensive charts and data that can help you make informed investment decisions.
- The Tradestation charting package is well integrated with the order management system, making it easy to place orders and track their progress.
- TradeStation Analytics offers access to tools to help you better understand the markets and make better trading decisions.
- TradeStation’s Matrix window combines the benefits of a market depth window and order tracking system into a single window.
- Provides technical and fundamental analysis for up to 1,000 symbols in real-time.
- Integrated probability cones and position graphs make it easy to understand your trading positions.
- Phone, email, live chat, and the online Client Center are all available to help you get in touch with TradeStation reps when you need it.
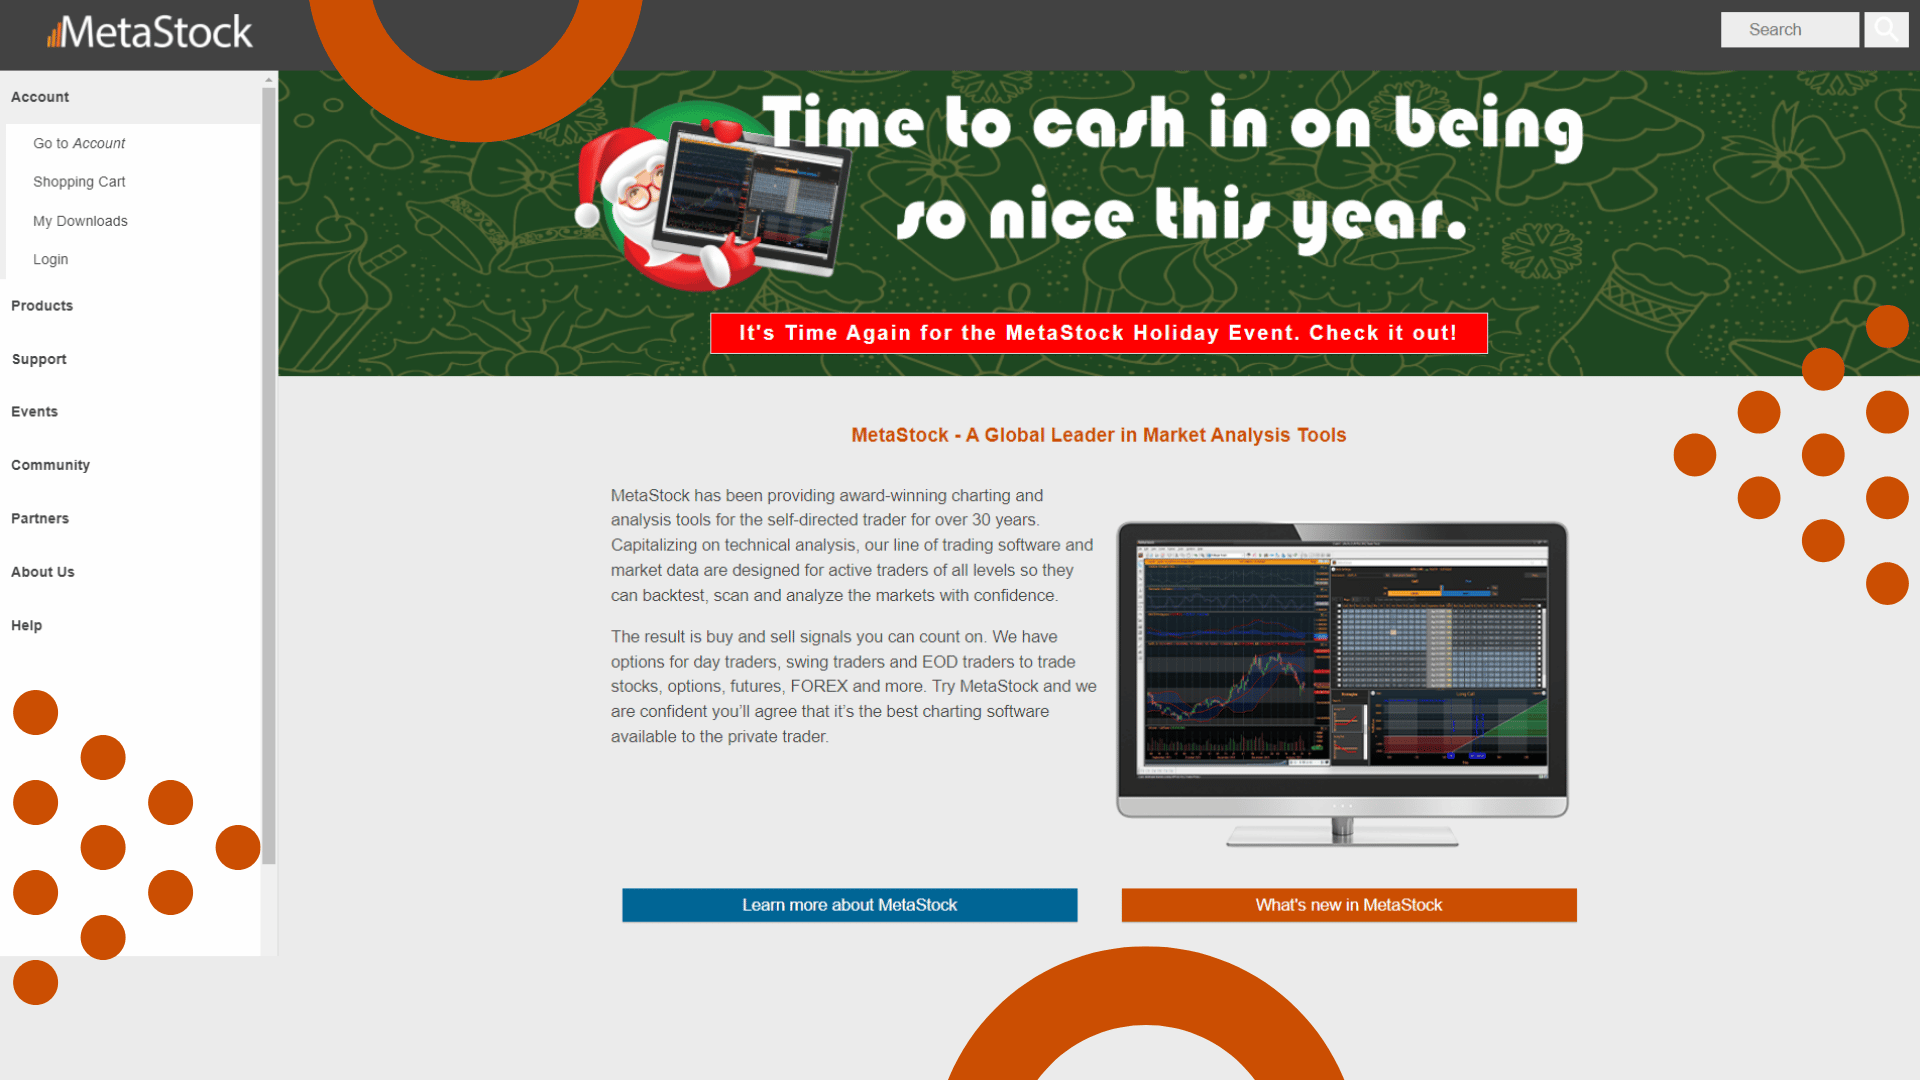
MetaStock is a powerful technical analysis software that allows you to make better decisions about when to buy and sell stocks. It is available for purchase in multiple subscription types, and it is one of the most popular stock research software programs available.
Nick's Take
For me, its range of products is perfect for traders of all levels as this powerful tool has been around for over 30 years.
Features:
- Traders can utilize the Daily Charts to get some after-market analysis while MetaStock will assist real-time traders to reach their goals.
- MetaStock offers a range of products to suit different needs, including technical and fundamental analysis.
- The MetaStock Xenith provides fundamentals, real-time news from Reuters, as well as data, analytics, and commentary from industry experts.
- The Daily Charts and Refinitiv DataLink offer real-time information and historical data.
- Use MetaStock to identify opportunities and assess the risks associated with them.
- Scan the market to find instruments that match your criteria, backtest your strategies, and forecast future price action.
- Monitor lists for performance and risk factors, and plot risk using industry-leading charts.
Pricing:
MetaStock D/C – $499
13. VectorVest

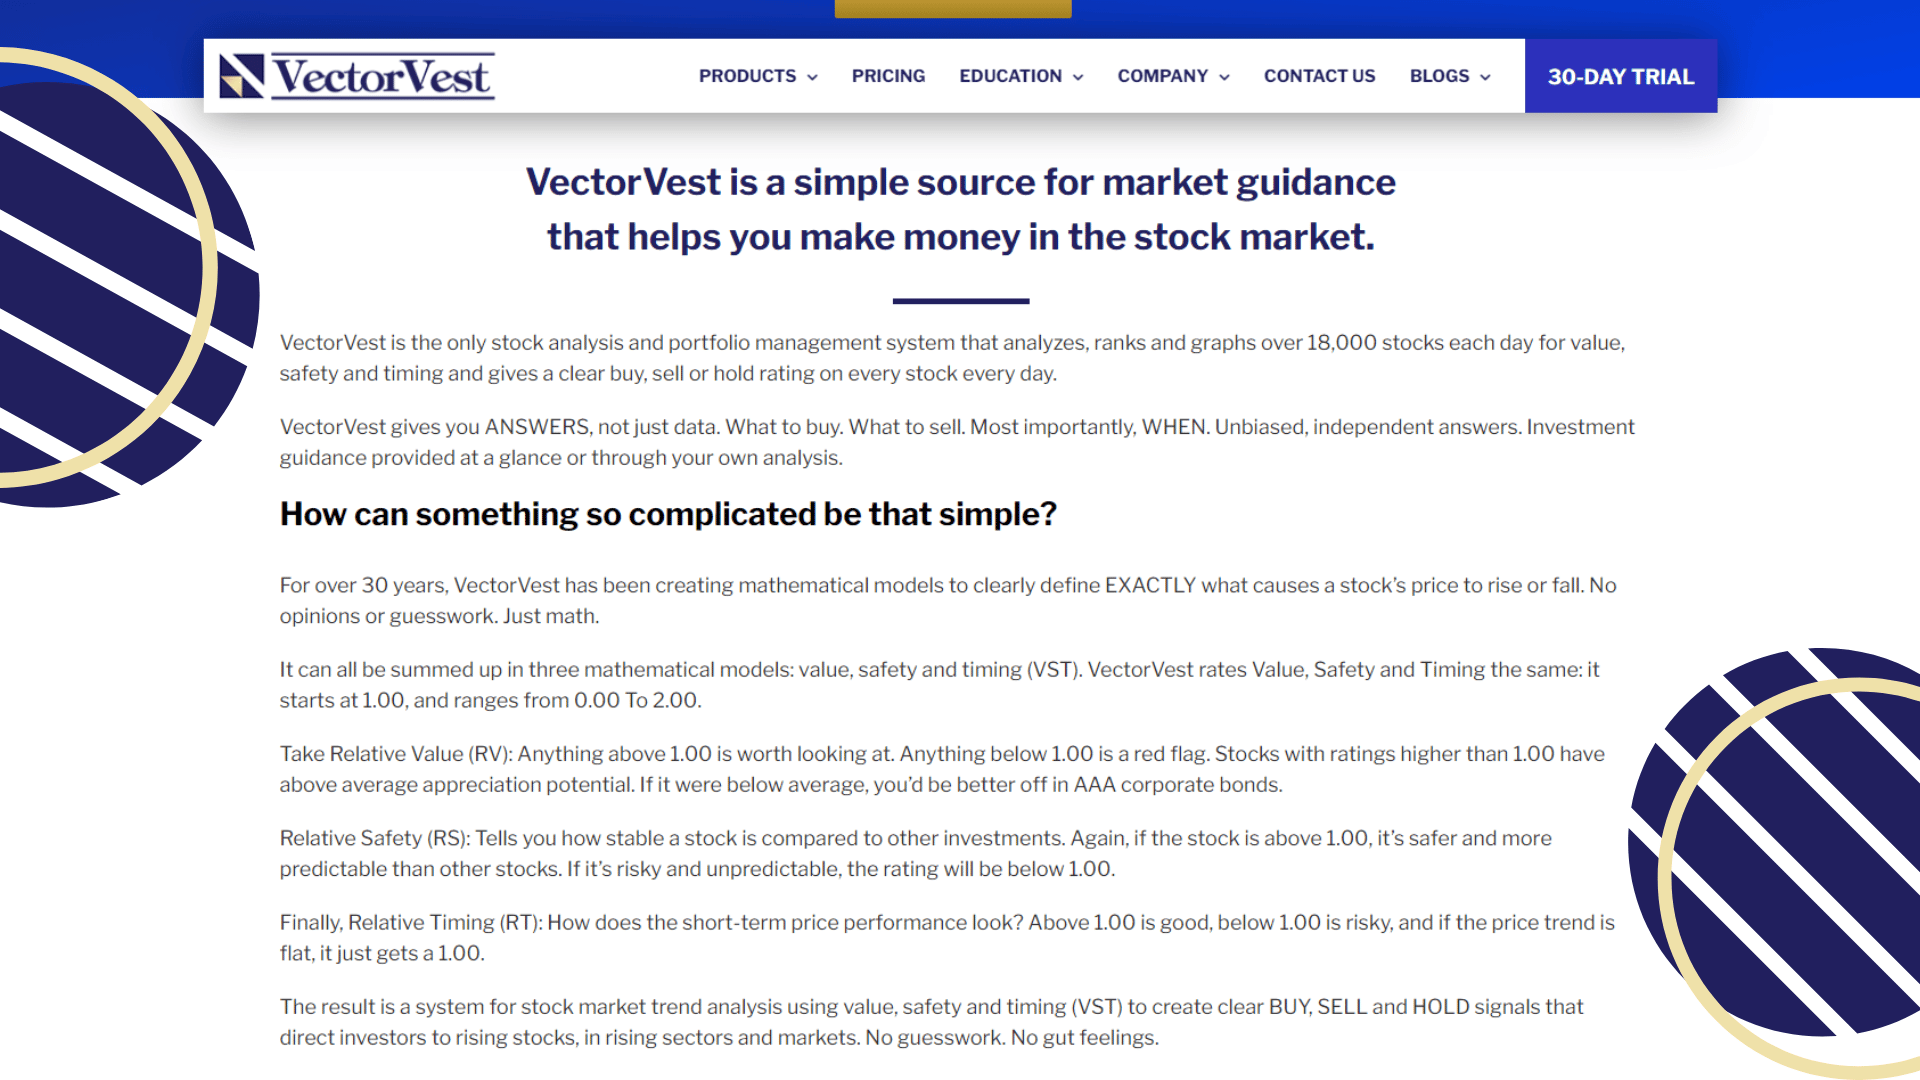
VectorVest is a premium investment software that is perfect for experienced traders who are looking for detailed insights into their investments. This software provides users with the ability to deploy time-tested strategies that are guaranteed to produce successful results.
Nick's Take
I think that VectorVest is ideal for independent investors who want to manage their stock portfolio and perform market research.
Features:
- VectorVest’s fundamental analysis helps you identify undervalued or overvalued stocks.
- Offers guidance on when to buy and sell stocks, as well as complete investing strategies.
- Has a high rating for safety, value, and timing.
- Has a portfolio management feature that allows users to see all of their investments in one place.
- Offers mobile access to portfolio data so users can view and track their investments from anywhere.
- VectorVest allows you to analyze and rank 18,000 stocks daily
Pricing:
Basic – $69/month
Enhanced – $99/month
Premium – $149/month
14. Uncle Stock
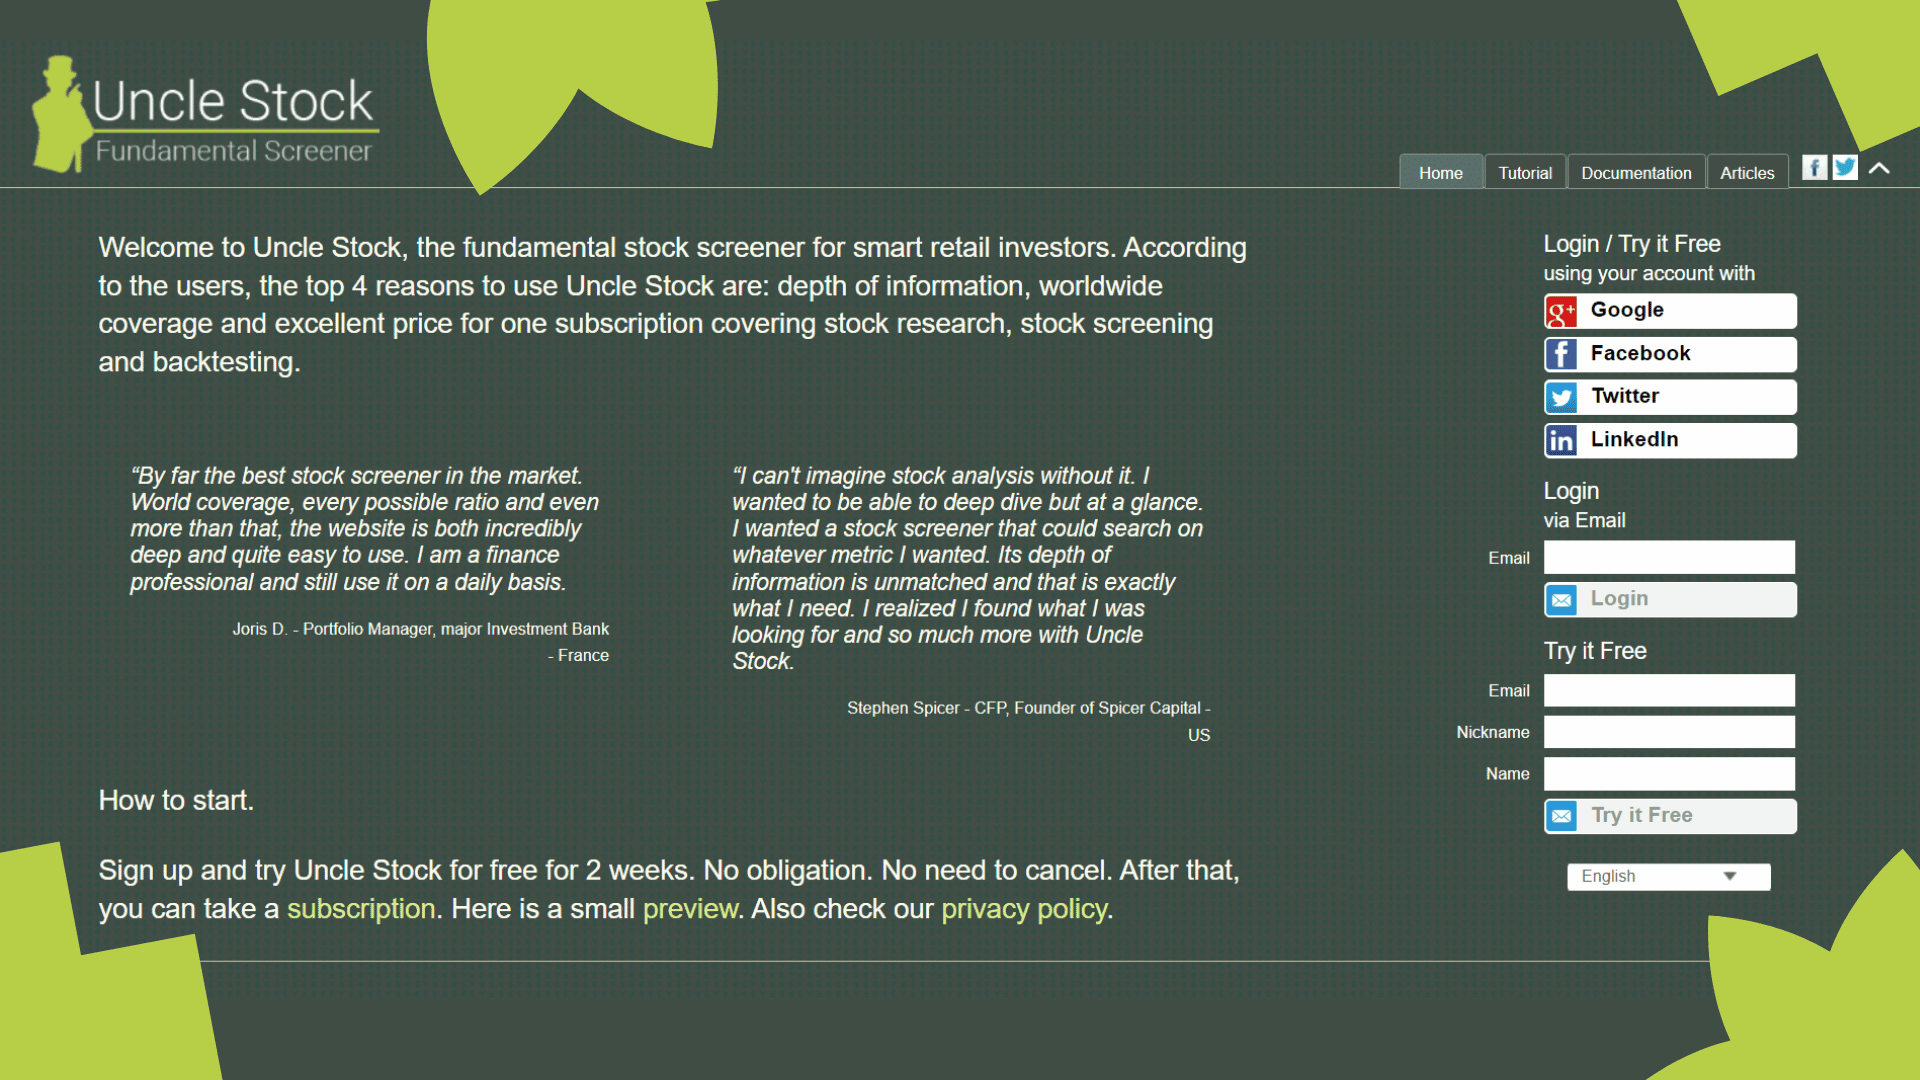
Uncle Stock is a powerful stock screener with a long history of data. The platform is well-explained and helpful to understand financial figures. Uncle Stock is a niche product that differentiates from its bigger competitors by the depth of analysis, market coverage, integrated backtest, and product price.
Nick's Take
It seems to me that the depth of information and worldwide coverage are the top reasons to use Uncle Stock.
Features:
- Has a huge amount of data that can be used to analyze stock performance.
- Provides financial results from 1994 and indicators from 2000.
- Allows users to screen for stocks based on most metrics.
- Has a great backtest function that lets users see how their hypothetical strategies have performed in the past.
- Provides a comprehensive overview of the stock market and allows users to explore markets outside of North America and Europe.
- The news section aggregates news from Yahoo Finance and Seeking Alpha.
- Use predefined queries to find stocks that match your criteria.
- Allows you to compare different stocks and track your progress over time.
Pricing:
Bronze – $15/month, $119/year
Silver – $24/month, $186/year
Gold – $39/month, $311/year
15. BlackBoxStocks
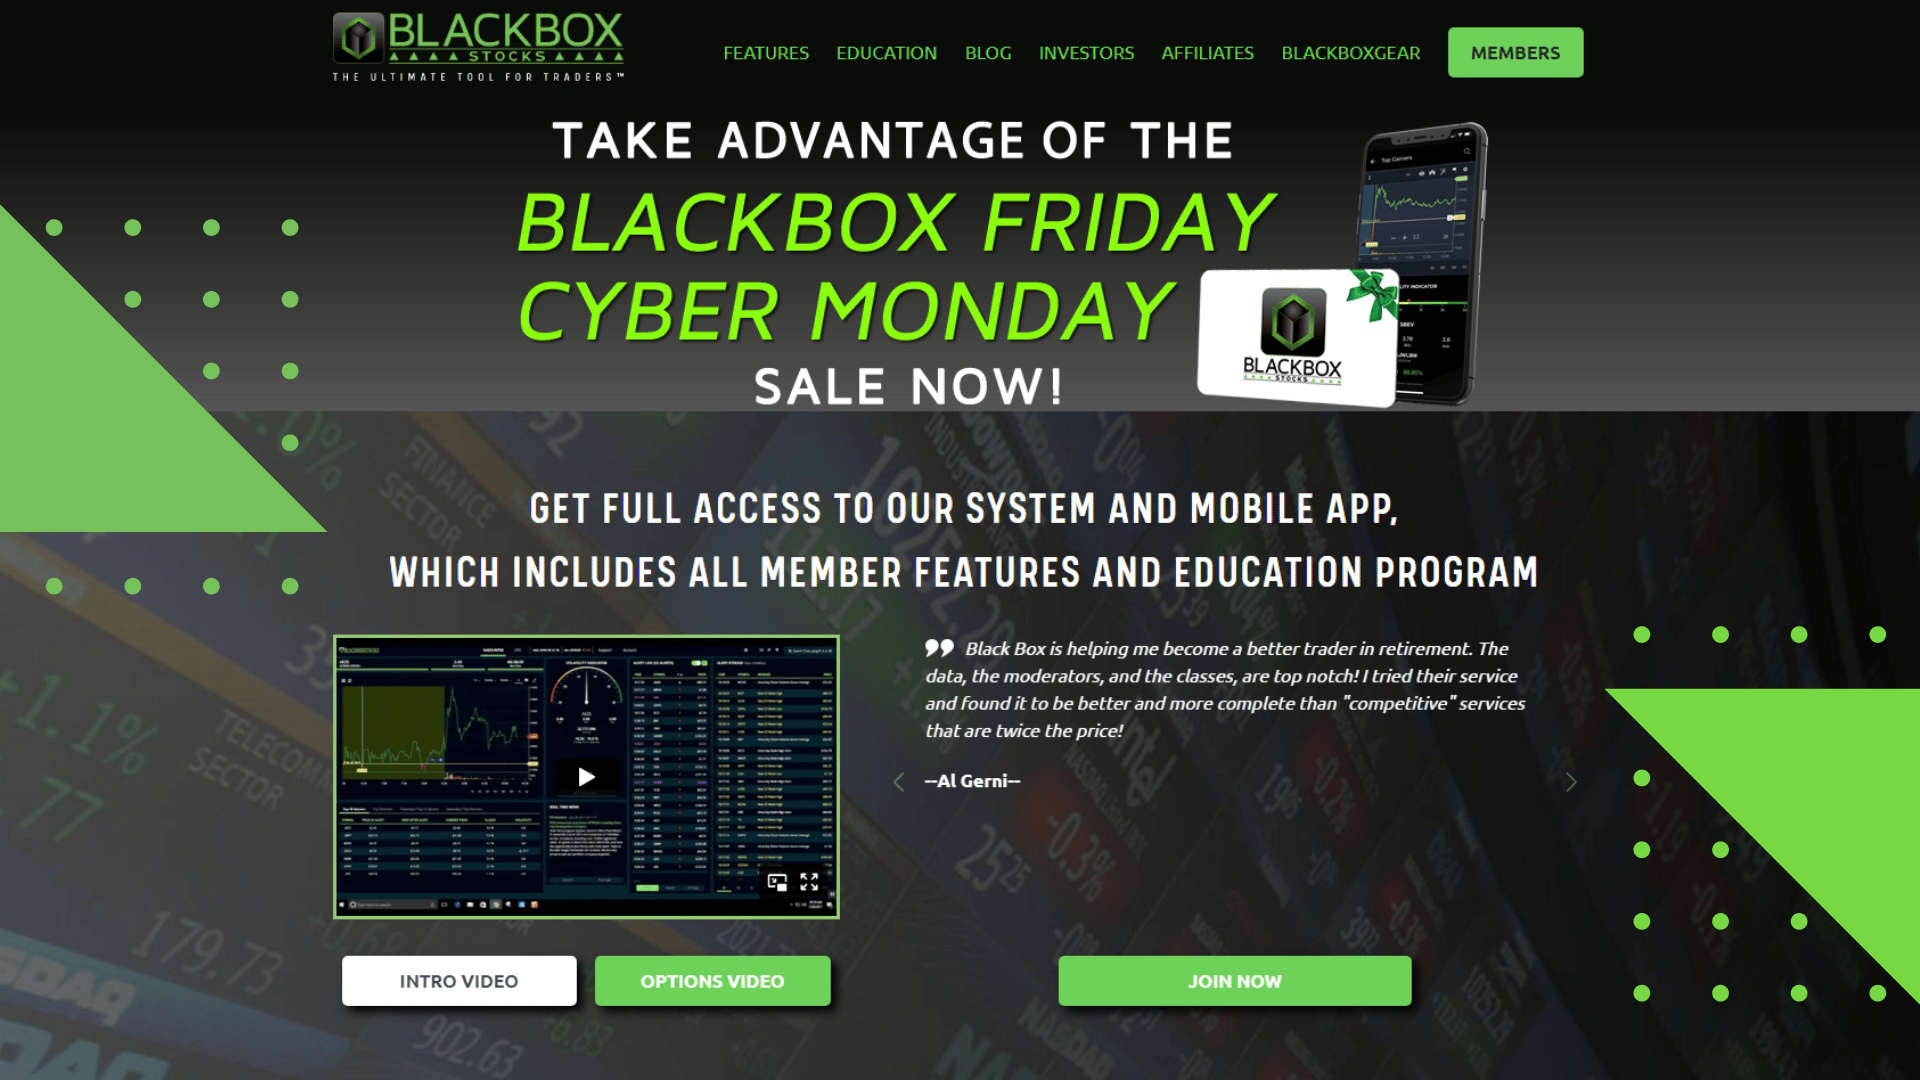
BlackBoxStocks offers traders a wide range of tools, including a great charting system that is perfect for options trading. The BlackBoxStocks platform is fast and reliable, making it the perfect choice for options traders. The BlackBoxStocks team of experienced mentors provides high-quality education every week to help you improve your options trading skills.
Nick's Take
It seems to me that the integrated data feed makes BlackBoxStock one of the most convenient platforms out there.
Features
- BlackBoxStocks offers educational components as well as a stock screener and unusual options scanner.
- A stock screener which uses advanced artificial intelligence algorithms to find the best stocks to trade.
- The screener includes pre-defined scanning logics and filters to find the best stocks to trade.
- The BlackBoxStocks feature allows you to see the latest stock prices and charts in real time.
- The volatility indicator shows you the last price, traded volume, and change from yesterday.
- The Real-Time News feature lets you watch live news feeds for free to get updates on market movements.
- The options scanner allows you to scan for unusual activity, such as big prints or halts.
Pricing:
Monthly Billing – $99.97/month
Yearly Billing – $959/year (save $240.64)
16. NinjaTrader
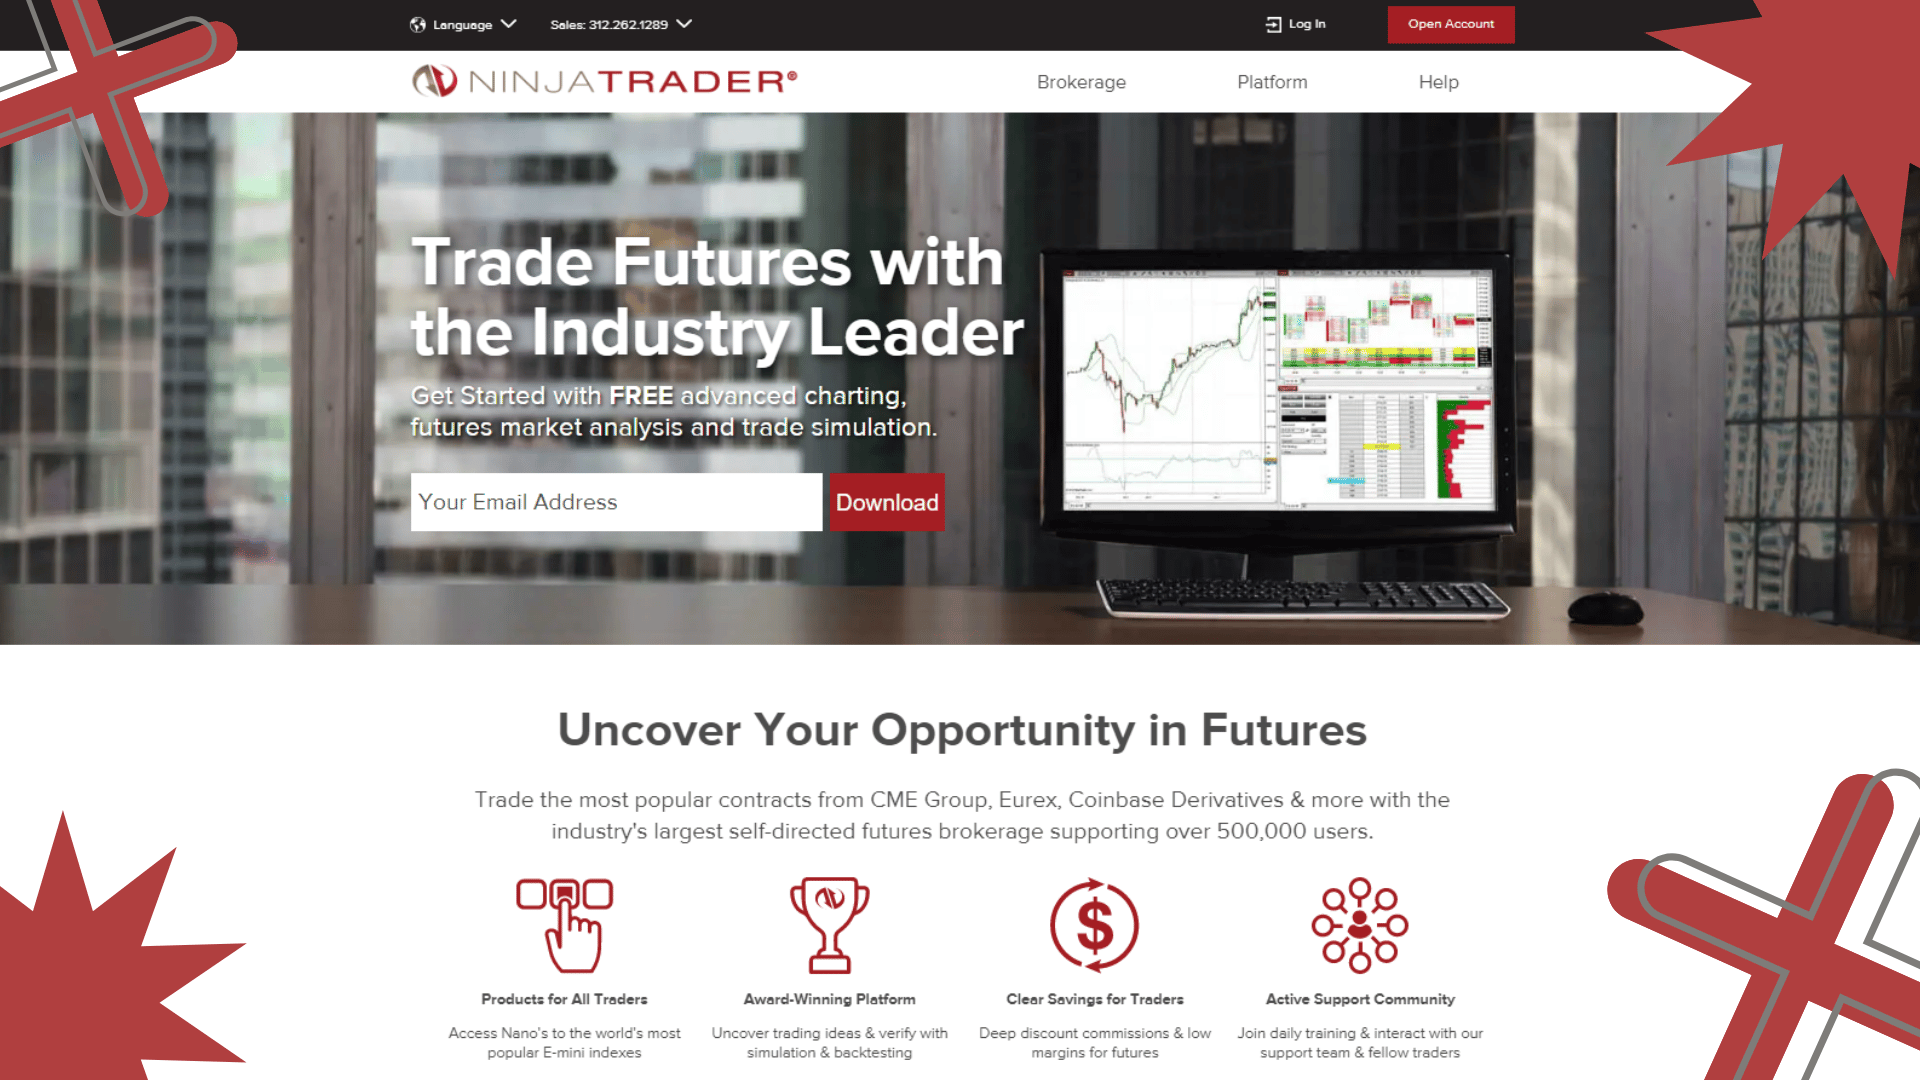
NinjaTrader is a great stock analysis tool with many features. You can use NinjaTrader to chart stocks, create watchlists, and conduct market analysis. Additionally, NinjaTrader offers a trading simulator so you can test your trading strategies before risking real money. However, one downside of NinjaTrader is that it is more difficult to create trading strategies than with Trade Ideas Pro.
Nick's Take
I think that with NinjaTrader, you’ll have access to real-time analysis of hundreds of markets, as well as advanced alerting capabilities that can trigger custom notifications, social media sharing, and orders based on analysis.
Features
- Comes with real-time market analysis and advanced alerting capabilities.
- Offers unlimited simulated trading.
- Offers third-party trading indicators and apps which are specifically tailored to the platform.
- Allows you to analyze your past performance using historical data.
- Enables you to trade with as little as $400 – making it an affordable choice whether you’re starting or an experienced trader.
- The Tick Replay option allows for more accurate chart analysis.
- The Time Frame section lets you choose the number of days for the chart to be displayed, as well as different sessions for trading.
- The color of the candle shadows and body can be customized.
- The Write NinjaTrader features include the Trading Hours Break line, Trades section, and Properties tab.
- The Right Side Margin and Chart Background Image options help you to better view your charts.
Pricing:
Free – $0
Lease – $720/annual, $425/ semi-annual, $225/quarterly
Own – $1099 One-time payment, $329 four monthly payments
17. Benzinga Pro
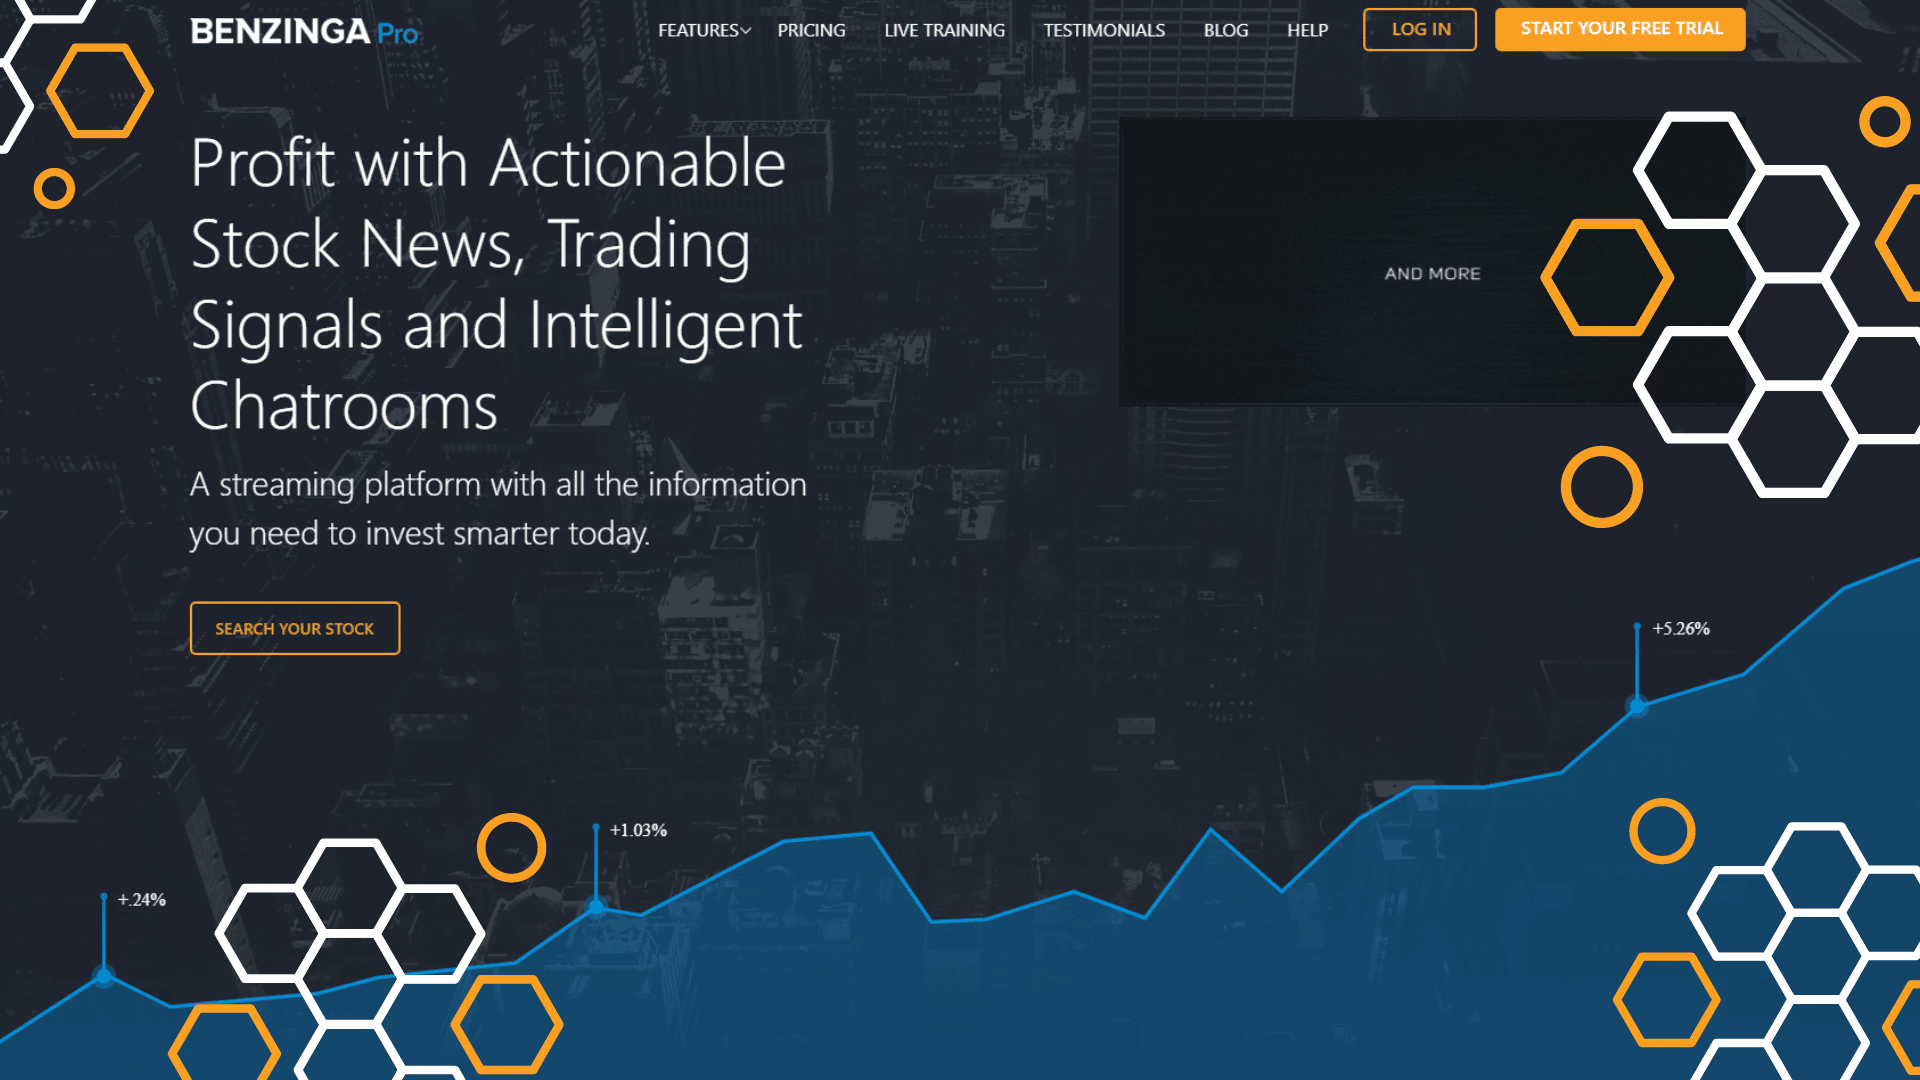
Benzinga Pro is a comprehensive investing tool that offers more than just news and audio. It also provides stock market analysis, broad market coverage, technical analysis with charting and indicators, SEC filing research, and integrated trading chat rooms.
Nick's Take
From my perspective, Benzinga Pro is a great place to start if you’re still unsure about which investment style to choose.
Features:
- Offers premium features such as real-time NASDAQ quotes, stock watchlisting, detailed stats on key stocks, and more.
- The Benzinga Pro newsfeed alerts allow you to be alerted about specific stocks or market sectors.
- You can also set up watchlists and receive real-time alerts and summary emails for your watchlist.
- The Benzinga Calendar Suite lets you see what upcoming news is important to the market analysts
- The hover feature allows traders to see how recent news events have affected stock prices quickly and easily.
- The Security Snapshot View is a great way to quickly overview all the financial documents for a given stock.
- Benzinga Signals is an innovative way to provide stock market information to its users.
- Benzinga Signals offers users a feed with important stock market information.
Pricing:
Free – $0
Basic – $27/month
Essential – $177/month
Options Mentorship – $347/month
What is stock chart software?
Stock charting software allows you to visualize stock market data, spot emerging patterns, and analyze trends. Charting solutions help traders with technical Analysis which attempts to predict the market using historical and current data.
This type of software will typically be able to provide investors with:
- Performance of publicly traded companies, historical and current
- Live updates on stock price and trading volumes
- Investment recommendations based on user-defined or automated triggers
What are the advantages of using stock charting software?

No matter how skilled a trader is or asset manager, their ability to process large amounts of data will limit them. Stock charting software can simplify pattern recognition and speed up decision-making.
These are the top advantages of charting software:
Visualize past trends clearly
A chart can show you a thousand data points. It’s hard to understand historical data if it isn’t mapped onto a cohesive visual.
Technical analysis involves analyzing past trends to make informed investments. Stock charting software makes it easy to do this because it displays data points in a visually appealing way. This makes it easier to spot changes and evaluate the historical performance.
Spot patterns
Depending on which market charting software you use, you may get some assistance from the algorithms to recognize patterns, generate trading ideas, and make specific buy/sell choices.
You can also set up rule-based triggers that are specific to your preferences and/or analytical models. Charting software will alert you when a trade might be advisable so you can respond accordingly.
Compare similar stocks easily
You will need to be able to quickly compare stocks if you have a limited number of options.
Stock charting tools make it easy to do just that. This type of technical analysis tool allows you to compare similar stocks to help you see the benefits and drawbacks of each.
This data-based comparison makes it easier to choose the right investment.
Real-time response
The best stock chart software will give you real-time market data.
This is particularly relevant for day traders, who might be doing multiple transactions in a single day to capture the right highs or lows.
Even if you aren’t focusing on the short-term, it is important to have the most current information so that you don’t miss any developments in your final investment decision.
Take objective decisions
Charting software is a great tool for making decisions. This makes it easier for you to make objective decisions. Traders and investors are human beings, so they can have biases about certain stocks, or react emotionally to market changes.
These subjective factors can be eliminated or at least minimized by technical analysis solutions. Charting software makes it possible to present only the facts, trends, or patterns and make investment decisions that are calculated rather than spontaneous.
What factors should you consider when choosing the best stock chart software?

You don’t need the right software to trade the stock market. The first step in choosing a stock charting program is to identify the features that you need and then decide how much you are willing to spend on them.
It’s easy to use
Stock charting software should be easy to learn and provide extensive support documentation. You should find it easy to use, with clear navigation and analysis tools that allow you to easily see the chart. It is essential to be able quickly make decisions and evaluate potential opportunities.
Capabilities of Advanced Charting
Many charting apps also have advanced features that enable you to set up alerts when certain conditions occur during intraday trading. Backtesting is another feature that allows you to practice trading using one or more strategies over a long or short period. The ability to draw freely and make annotations on charts helps you visualize concepts and enhances your understanding of trades.
Customizable Interface
You should be able to see all the information you need. Don’t spend time cluttering up your screen with things you don’t want or don’t need. Stock charting software should be fully customizable so you can make it exactly how you want.
Mobile App
The pace of life is always changing. Your ideal program should also have a mobile app. You should be able to access your program from anywhere if you have a mobile device. This will allow you to keep up with all the latest information about your trades.
Conclusion
There’s no doubt that stock chart software can give you an edge in the markets. But with so many options out there, it can be tough to know which one is right for you.
Our list of the 17 best stock chart software for traders in 2022 will help you narrow down your options and find the perfect tool for your needs. So whether you’re a beginner or a seasoned pro, you’re sure to find software that suits your trading style.
So what are you waiting for? Start trading with the best stock chart software now!